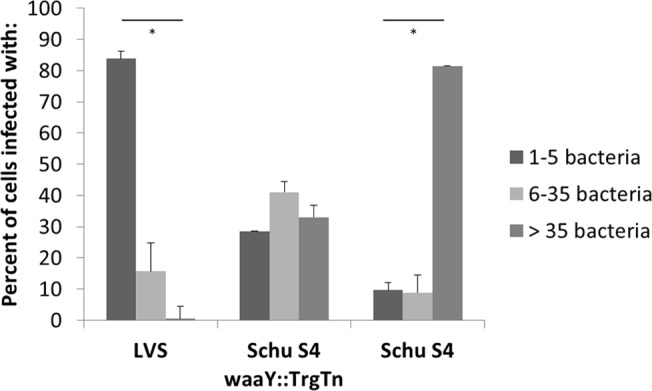
Fig 3. Scoring of growth patterns observed in confocal imaging.

Infected cells were classified into three separate categories based on the amount of bacteria each cell contained at 24 hpi. Cells infected with Schu S4 had significantly more bacteria per cell compared to cells infected with LVS 24 hpi (*P <. 001). Percentages were calculated from greater than 300 cells containing organisms from three independent experiments.
