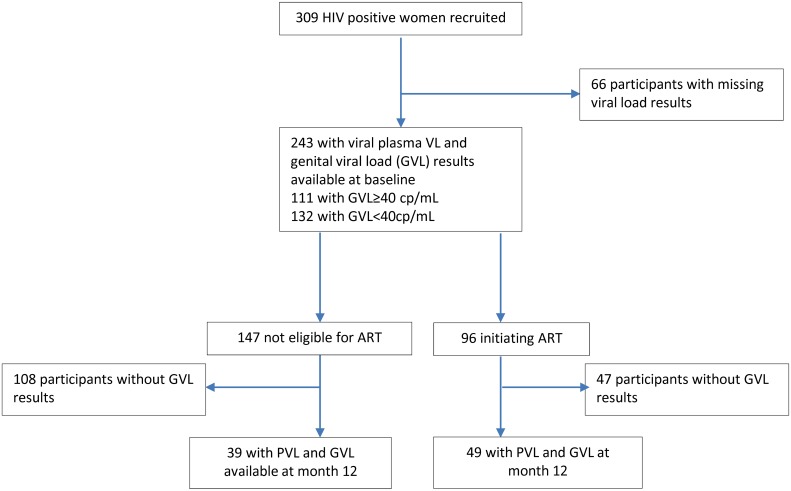
Fig 1. Cohort profile.
This flow chart provides information on the number of patients recruited, eligible for antiretroviral therapy and who had viral load and CD4 data available at baseline and at month 12. Patients were classified in groups of genital viral load (GVL) <40 RNA copies/ml and GVL ≥40 copies /mL.

