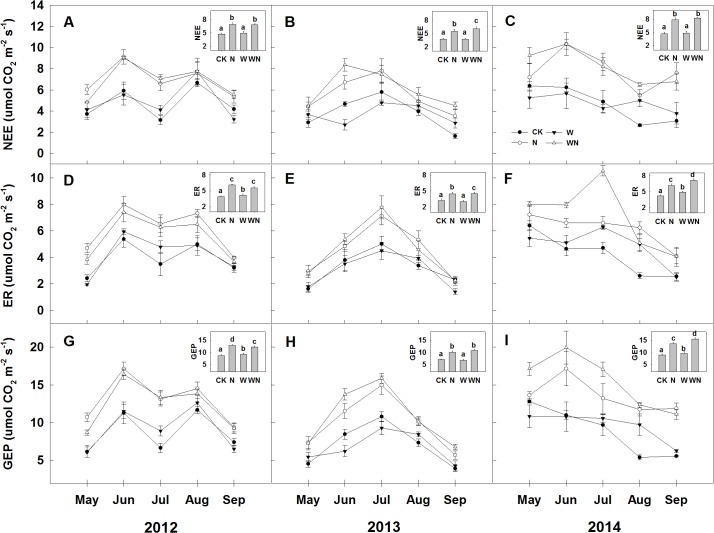
Fig 3. Seasonal dynamics and means of (A, B, and C) net ecosystem CO2 exchange (NEE, μmol m-2 s-1), (D, E, and F) ecosystem respiration (ER, μmol m-2 s-1), and (G, H, and I) gross ecosystem productivity (GEP, μmol m-2 s-1) in 2012, 2013, and 2014.
Different lowercase letters indicate significant differences (P < 0.05) in seasonal averages among treatments (Duncan’s test). CK: control; W: water addition; N: nitrogen addition; WN: water and nitrogen added in combination. Data are reported as mean ± 1 SD (n = 6).

