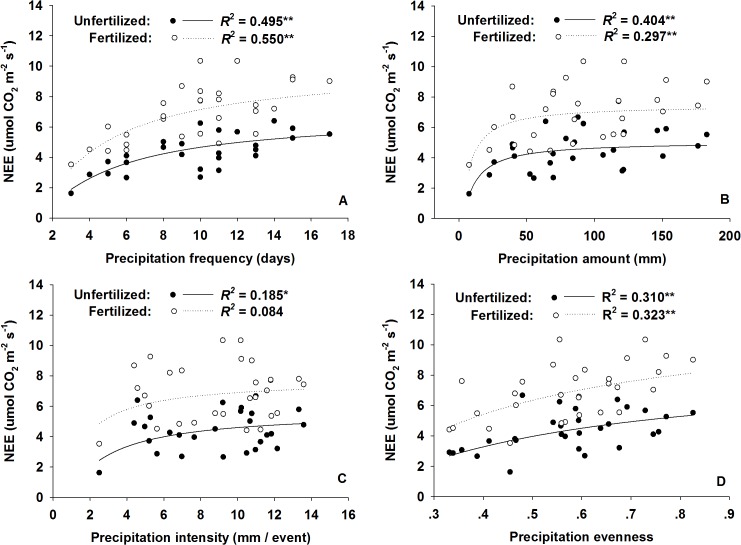
Fig 6. Responses of net ecosystem CO2 exchange (NEE, μmol m-2 s-1) to monthly precipitation regimes (A, frequency; B, amount; C, intensity; D, evenness) across the 3 years for both nitrogen fertilized (open circles, A: y = Exp(2.240 – 2.662x-1); B: y = Exp(2.017 – 6.269x-1); C: y = Exp(2.053 – 1.190x-1); D: y = Exp(2.479 – 0.316x-1)) and unfertilized plots (solid circles, A: y = Exp(1.905 – 3.610x-1); B: y = Exp(1.613 – 9.101x-1); C: y = Exp(1.700 – 1.983x-1); D: y = Exp(2.141 – 0.381x-1)).
Nitrogen fertilized plots include both N and WN plots, and unfertilized plots include both CK and W plots. Water addition was treated as a precipitation event and included in the calculation of monthly precipitation regimes. * and ** represent significant relationships at the P < 0.05 and P < 0.01 levels, respectively.

