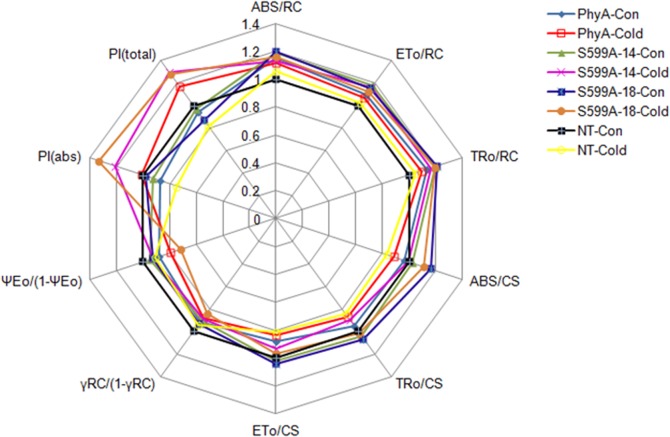
Fig 5. Radar plot with a series of parameters derived from JIP-test analyses of the experimental fluorescence OJIP transients.
This plot depicts possible differences in the structure and function of the photosynthetic apparatus under different conditions; PhyA plants under normal conditions (PhyA-Con) as closed blue diamonds, PhyA plants under cold stress (PhyA-Cold) as open red squares, S599A-2-14 plants under normal conditions (S599A-2-14-Con) as closed green triangles, S599A-2-14 plants under cold stress (S599A-2-14-Cold) as pink crosses, S599A-2-18 plants under normal conditions (S599A-2-18-Con) as closed blue squares, S599A-2-18 plants under cold stress (S599A-2-18-Cold) as closed brown circles, non-transgenic plants under normal conditions (NT-Con) as closed black squares and non-transgenic plants under cold stress (NT-Cold) are depicted as open yellow circles. The deviation of the behavior pattern from the regular polygon demonstrates the fractional impact, compared to the untreated plants of the corresponding treatment. Details of each parameter are discussed in the Results section.

