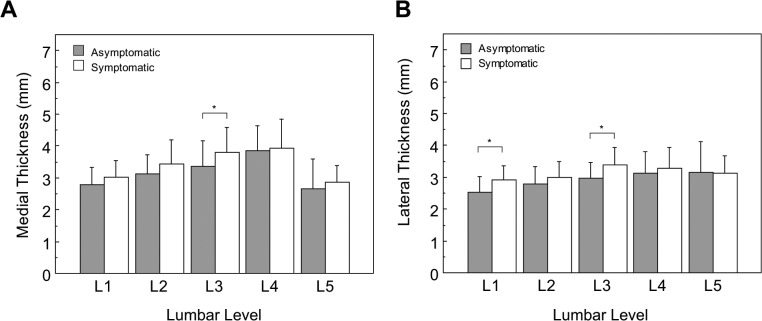
Fig 2. Medial (A) and Lateral (B) ligamentum flavum thickness variation by lumbar level.
Comparison between asymptomatic and chronic low back pain subjects segregated by spinal level. Error bars span one standard deviation. Asterisks denote significant differences with * p < 0.05. In (A) the symptomatic medial thickness tended to be larger than in the normal (L1: p = 0.0839, and L2: p = 0.0652, respectively). All other comparisons did not reach significance.

