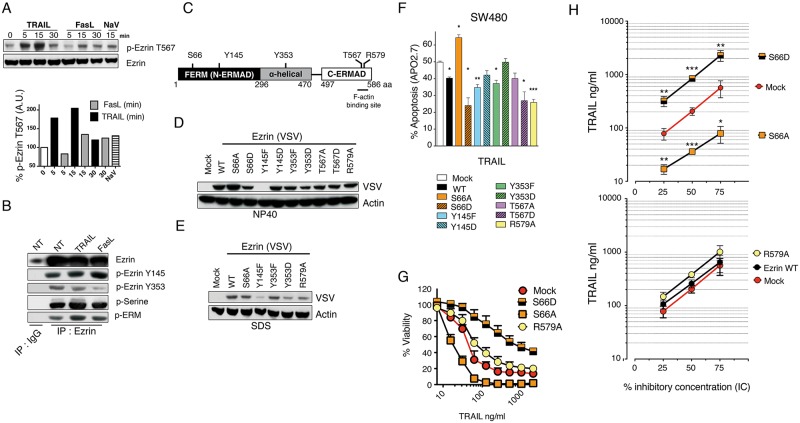
Fig 2. Ezrin phosphorylation on serine 66 differentially affects its ability to inhibit TRAIL-induced apoptosis.
(A) Immunoblot analysis of phospho-ezrin (Thr567) expression levels in SW480 cells after stimulation with His-TRAIL, Fas ligand or orthovanadate (NaV). Percentage of relative phospho-ezrin (Thr567) intensities were determined as follows: intensity of specific band in stimulated cells divided by the normalized intensity of unstimulated cells, normalized to HSC70. (B) SW480 cells were stimulated with 500 ng/ml His-TRAIL or 100 ng/ml Fas ligand for 15 minutes or left untreated. After cell lysis in NP40-containing buffer, ezrin was immunoprecipitated with an anti-ezrin antibody (clone 3C12). The level of ezrin phosphorylation was determined by western blot using anti-phospho-ezrin targeting tyrosines 353 and 145, anti-phospho-ERM recognizing phosphorylated-ezrin on threonine 567,-moesin on threonine 558 and-radixin on threonine 564 and an anti-pan phosphoserine. (C) Schematic representation of ezrin domains and phosphorylation sites within the protein. (D) SW480 cells were infected with an empty pMSCV retroviral vector (Mock) or with a pMSCV vector encoding ezrin WT, ezrin S66A, ezrin S66D, ezrin Y145F, ezrin Y145D, ezrin Y353F, ezrin Y353D, ezrin T567A, ezrin T567D and ezrin R579A. Expression levels of ezrin constructs were determined by immunoblot from NP40 cell extracts using an anti-VSV antibody. Actin was used here as a loading control. Data shown is representative of three independent experiments. (E) Selected cell extracts obtained after lysis in SDS were analyzed by immunoblot as above. (F) Effect of ezrin WT and ezrin phosphomutants ectopic expression on TRAIL-induced cell death in SW480 cells. Cells were stimulated with TRAIL 500 ng/ml for 6 hours. Apoptosis was measured by APO2.7 staining by flow cytometry. (G) Cell viability in the SW480 cells expressing ezrin S66A, ezrin S66D or ezrin R579A as compared to Mock infected cells was evaluated by methylene blue assay 24h after treatment using increasing concentrations of His-TRAIL. (H) Percent inhibitory TRAIL concentration curves, in ng/ml, from SW480 cells expressing ectopically the indicated ezrin mutants were obtained by methylen blue staining 16h after increasing His-TRAIL concentrations. Corresponding IC25, IC50 and IC90, inducing 25, 50 and 90% cell death, were obtained using CompuSyn. Data represent mean ± SD of at least 3 independent experiments. *P<0.05; **P<0.01; ***P<0.001 respective to Mock control cells.

