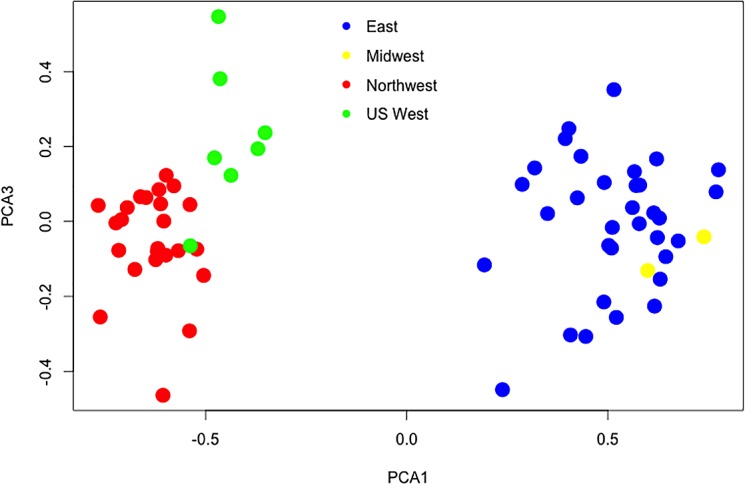
Fig 2. Principal component analysis using a pairwise population matrix of mean population codominant genotypic genetic distances among 66 North American populations of Cronartium ribicola.

First and third components, accounting for 70% and 7% of the total variability. East, Midwest, Northwest and US West refer to regions in S1 Table.
