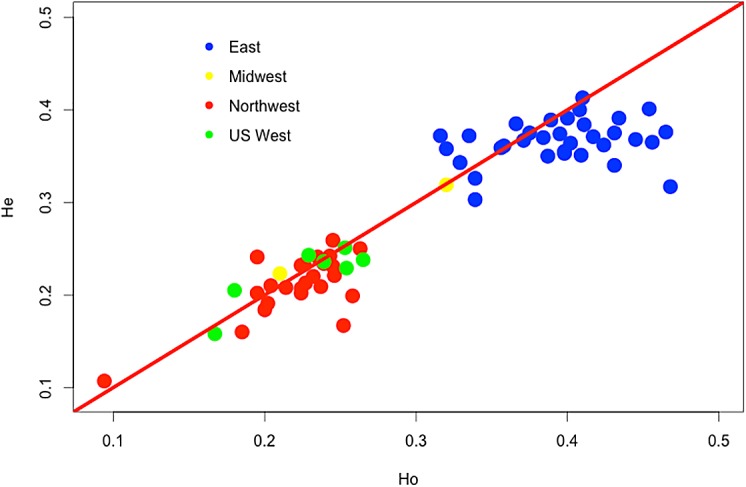
Fig 4. Observed and expected heterozygosity for 66 North American populations of Cronartium ribicola.

The red line represents identical values for expected and observed heterozygosity. Values above the red line represent populations where inbreeding is observed and those under the line represent populations with excess of observed heterozygotes.
