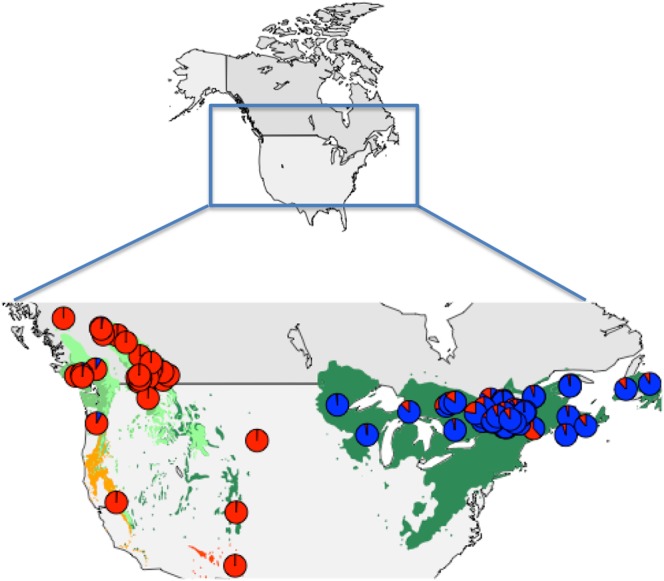
Fig 5. Distribution of white pines, the aecial host of Cronartium ribicola, in North America.

Each color on the map represents the range of a different white pine species. For each sampled population, the proportion of individuals assigned to each of the two clusters identified in Structure is plotted in a pie chart. The bar represents a barrier to gene flow identified using the Monmonier algorithm.
