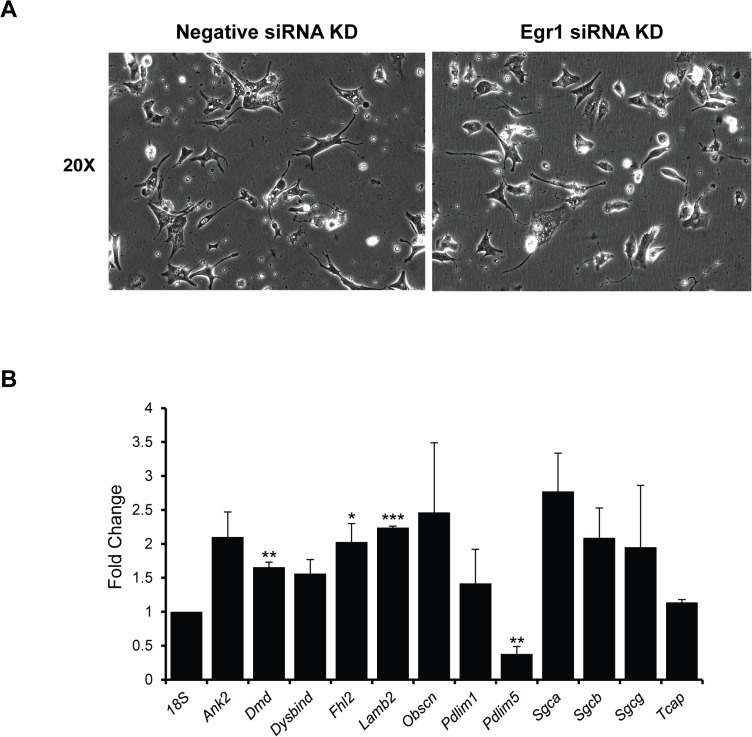
Fig 5. Costamere gene expression is upregulated in EGR1-depleted NRVMs.
(A) EGR1 depleted NRVMs do not display any obvious morphological defects. NRVMs were transfected with 100 nM EGR1 siRNA and analyzed 72 hours post transfection. (B) HEK 293T cells were transfected with pcCMV-EGR1-Flag, and either a negative control or Egr1 siRNA. Western blot analysis probing for the Flag epitope shows loss of EGR1-Flag expression upon co-transfection with the Egr1 siRNA, though a confounding non-specific band is present slightly above the EGR1-Flag band. (C) EGR1-depletion results in upregulated costamere gene expression in NRVMs. qRT-PCR analysis of 13 MEF2-dependent costamere genes in EGR1 siRNA knockdown NRVMs shows that eight of the genes are significantly upregulated, and the majority of the remaining genes show a nonsignificant trend towards upregulationwhen EGR1 is knocked down; fold change is in comparison to expression levels in the negative siRNA knockdown controls, results were normalized to 18s. Sample size for Ank2, Dmd, Dysbind, Lamb2, Pdlim1, Sgcb, and 18s is n = 6. Sample size for Pdlim5, Sgca, Sgcg, and Tcap is n = 5. Sample size for Fhl2 and Obscn is n = 4, and the sample size for Xirp2 is n = 3., *p<0.05, ** p<0.01, ***p<0.001.

