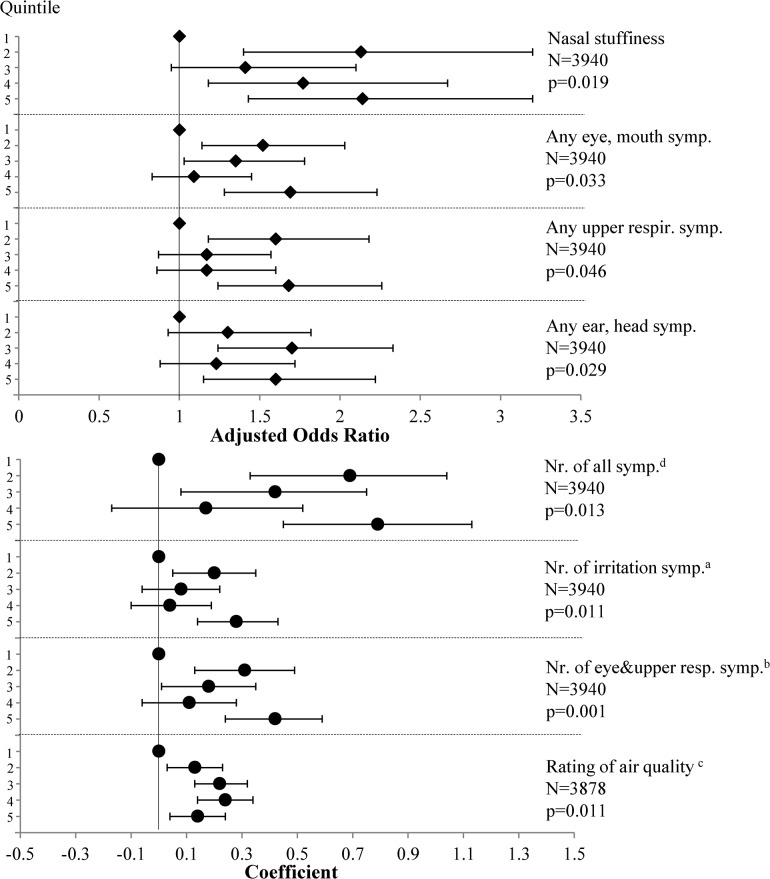
Fig 1. Significant concentration-response relationships between maximum ozone concentrations and reported symptoms/perceptions.
Results from logistic regression (aOR, 95% CI) are shown on top, linear regression (coefficient, 95% CI) on the bottom. a number of the following symptoms: watery eyes, itchy eyes, dry eyes, blurred dim altered vision, eye pain, runny nose or sneezing, dry irritated or sore throat, hoarseness/loss of voice, cough; b nose bleed and sinus pain/pressure/congestion were included among the ear, head symptoms in these tests, not among eye and upper respiratory symptoms; c 1 = Very good, 2 = Good, 3 = Adequate, 4 = Poor, 5 = Very poor; d number of all symptoms in the questionnaire (see full list under various symptom groups in the Methods).

