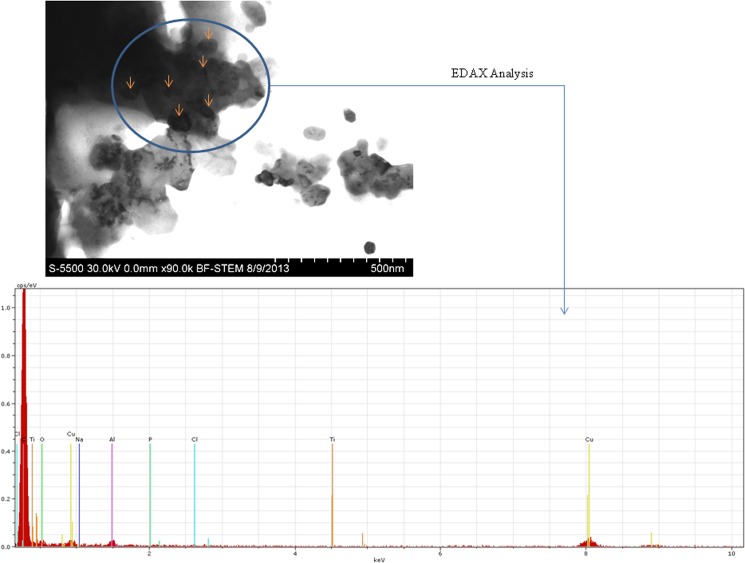
Fig 4. Cellular uptake of TiO2 nanoparticles is shown with the help of Scanning Transmission Electron image which was confirmed with EDAX analysis at several regions within the cell.
Nanoparticles inside the cells are marked with the arrows. Carbon (C), Oxygen (O), Phosphorous (P), Sodium (Na), Chlorine (Cl) etc. are the peaks observed for cellular components with Ti peak representing the presence of uptaken nanoparticles. The Cu peak is because of the copper grid used in the experiment.

