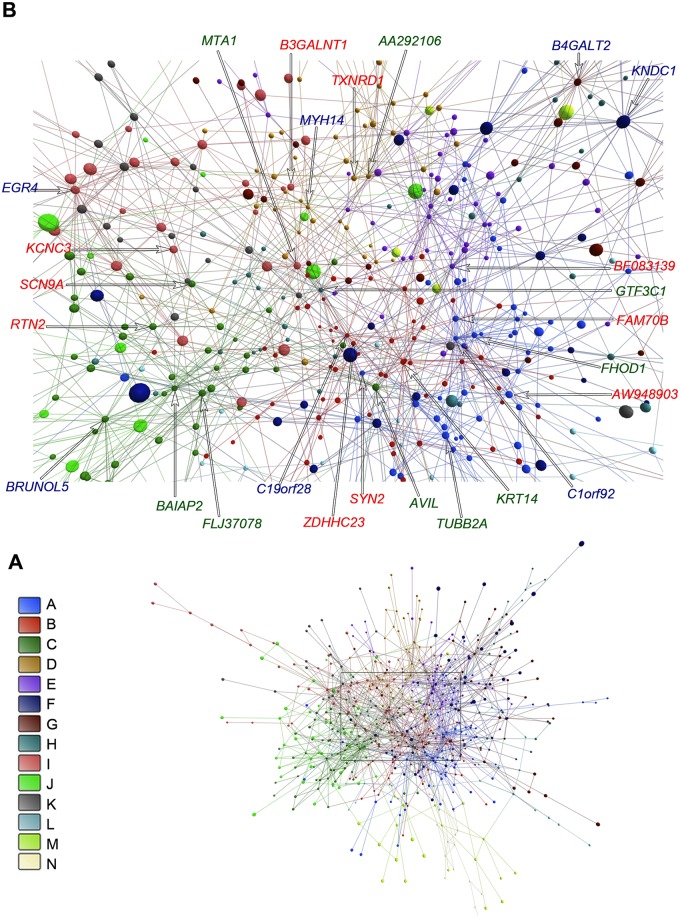
Fig 3. Community analysis for E-DE network.
The communities are indicated by different colors (A). Highly connected nodes (B) occupy central positions and their correspondent GO gene symbols are depicted in different colors corresponding to their hierarchical level: blue for hubs, red for VIPs, and green for high-hubs. In amplification B node size is not related to node degree.

