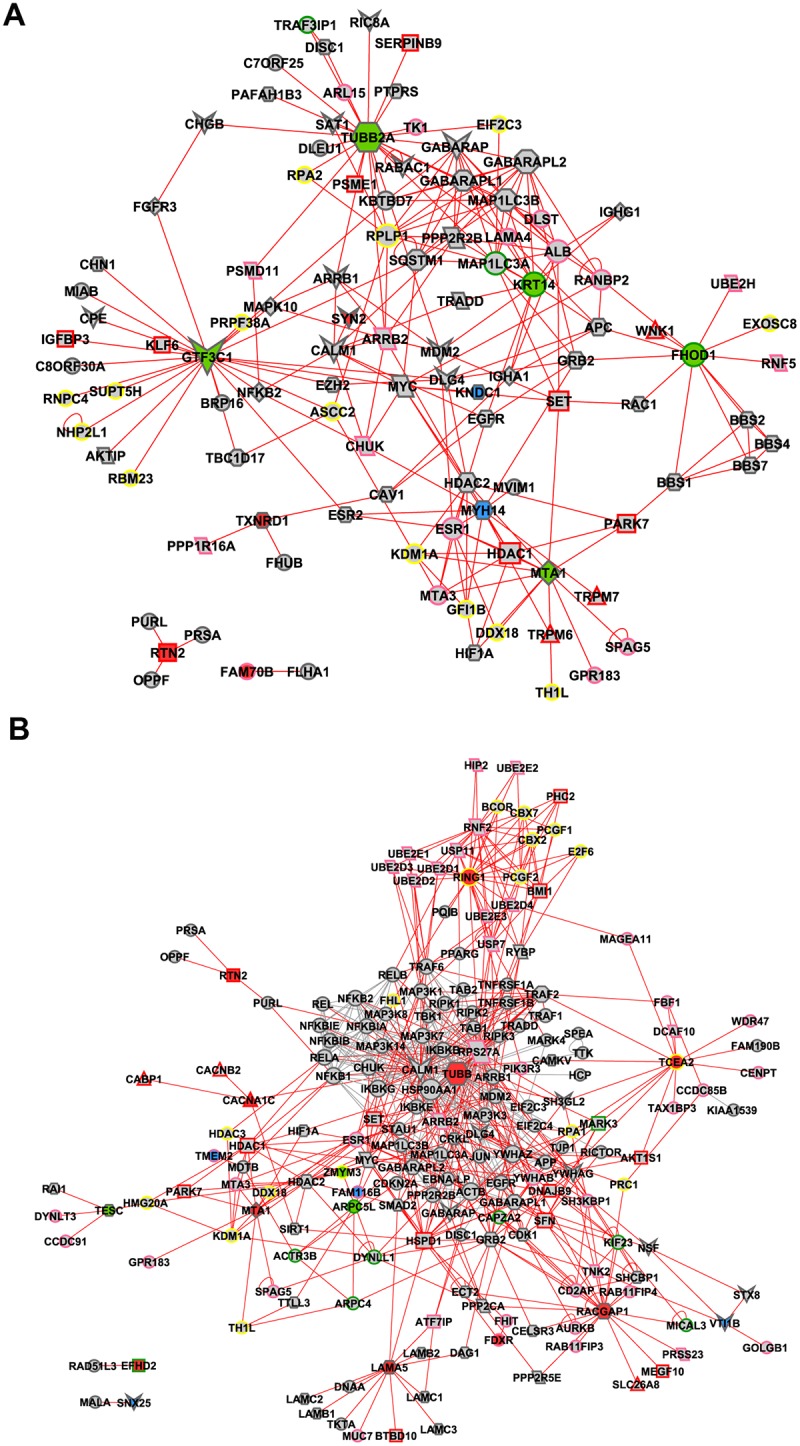
Fig 7. Interactome for DE networks.

Interactome for E-DE (A) and L-DE (B) selected hubs (depicted in blue), VIPs (depicted in red) and high-hubs (depicted in green) using MINT and IntAct databases. Node size is related to node degree (number of links). Links in red represent the first and second node connections, centered in all hubs, VIPs and high-hubs for E-DE and in all hubs, VIPs and high-hubs, except TUBB for L-DE. Node shapes and border colors represent biological processes, as follows: parallelogram for apoptosis; parallelogram with pink border for ubiquitination; octagon for autophagy; circle with pink or green or yellow border stand for cell processes or cytoskeleton or transcriptional regulation respectively; diamond for inflammation; triangle with red border stand for ion channel; rectangle with green or red or pink stand for neurodegeneration or neuroprotection or response to oxidative stress respectively; hexagon for neuronal development; vee for synaptic transmission.
