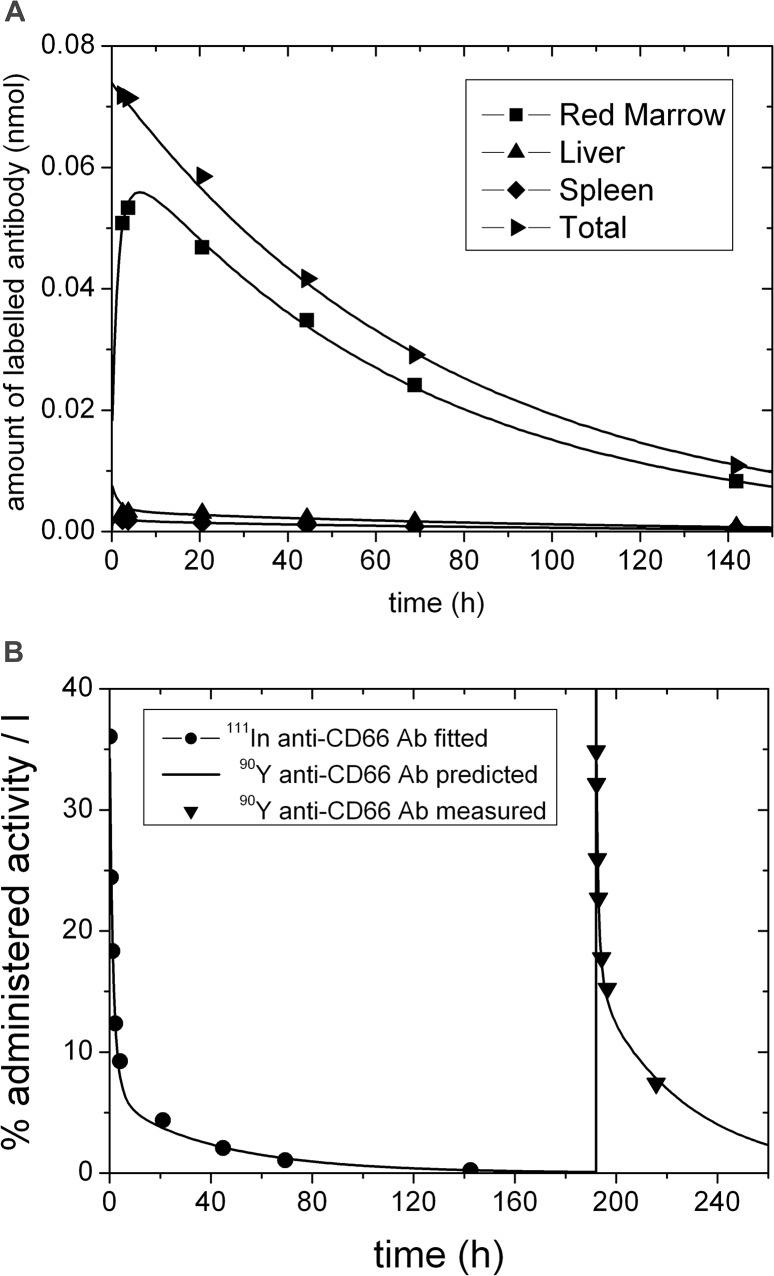
Fig 2. Typical biokinetic data, fit and prediction.
Biokinetic data and the pertaining fitted curves using model 2 (solid lines) for labeled anti-CD66 antibodies (A) in red marrow, liver, spleen and whole body and (B) in serum. The solid line for times larger than 190 h post injection depicts the excellent prediction for the therapeutic time-activity curve based on the fitted parameters of model 2 using pre-therapeutic data only. Note that for this patient no 48 h measurement was obtained. The corresponding red marrow kinetics for all patients are presented in supplement S2 Fig.

