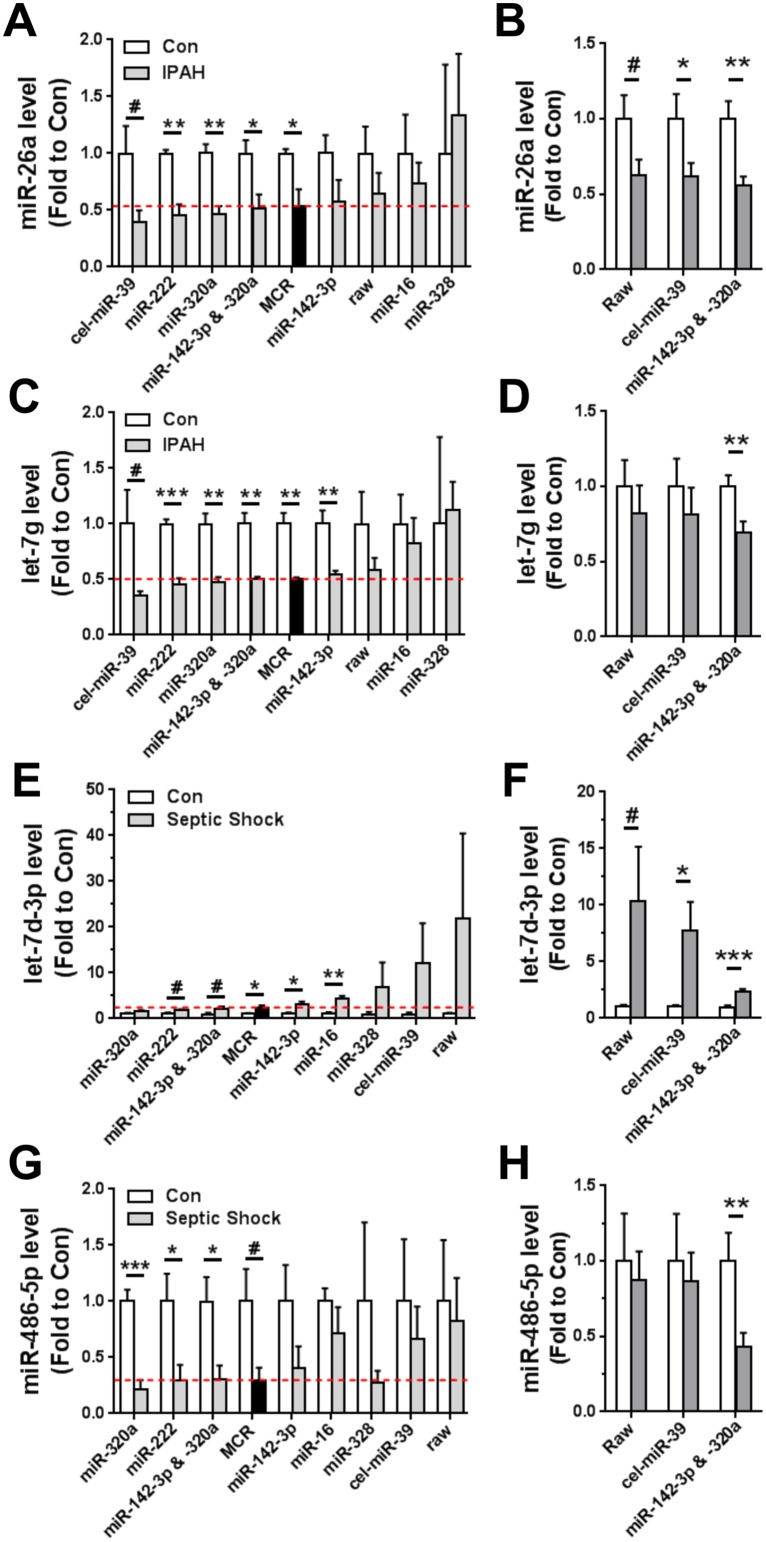
Fig 5. Effect of different normalization strategies on the accuracy of changes in specific miRNAs.
A, C. miRNA levels normalized to different reference controls in the PAH screening cohort (n = 4 IPAH, n = 3 healthy controls). B, D. Comparison of miRNA levels in a separate patient cohort (n = 14 PAH, n = 13 healthy controls) after normalization with internal (miR-142-3p & -320a) versus external (cel-miR-39) reference controls. E, G. miRNA levels normalized to different reference controls in septic shock (n = 4/group). F, H. Comparison of miRNA levels normalized with internal or external reference controls in a larger cohort of septic shock patients (n = 16 septic shock, n = 8 healthy controls). Unpaired t-tests were used with Welch's correction for unequal variances where appropriate. # p<0.1, * p<0.05, ** p<0.01, *** p<0.001 versus control. For perspective, the effects of normalizing to less stable miRNAs (e.g., miR-16 and miR-328) are also shown. Red dotted reference lines denote the magnitude of change considered to be most accurate, as set by the benchmark MCR normalization strategy. Raw denotes non-normalized data. Data are shown relative to the healthy control group (Con) and presented as mean ± SEM. The levels of miR-26a and let-7g normalized to miR-142-3p & miR-320a have been reported previously [21].

