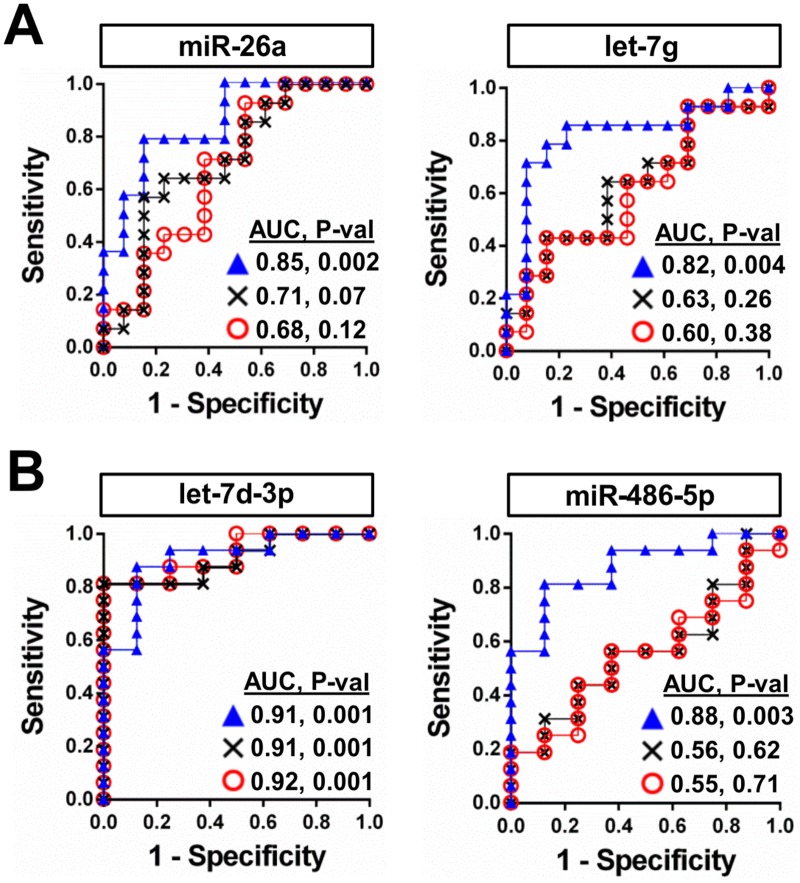
Fig 6. Effect of different reference controls on the diagnostic performance of potential miRNA biomarkers.
Receiver-operator characteristic (ROC) curves are shown for plasma levels of specific miRNA before (denoted by x) and after normalization by either internal (miR-142-3p/miR-320a; denoted by triangles) or external (cel-miR-39; denoted by circles) reference controls. A. miR-26a and let-7g in the PAH cohort (n = 13 healthy controls, 14 PAH patients). B. let-7d-3p and miR-486-5p in the septic shock cohort (n = 8 healthy controls, 16 septic shock patients). AUC denotes the area under the curve, which can vary from a minimum of 0.5 to a maximum of 1 (i.e., 100% sensitivity and specificity). P-val denotes statistical significance. ROC curve of miR-26a plasma levels normalized to miR-142-3p & miR-320a has been reported previously [21].

