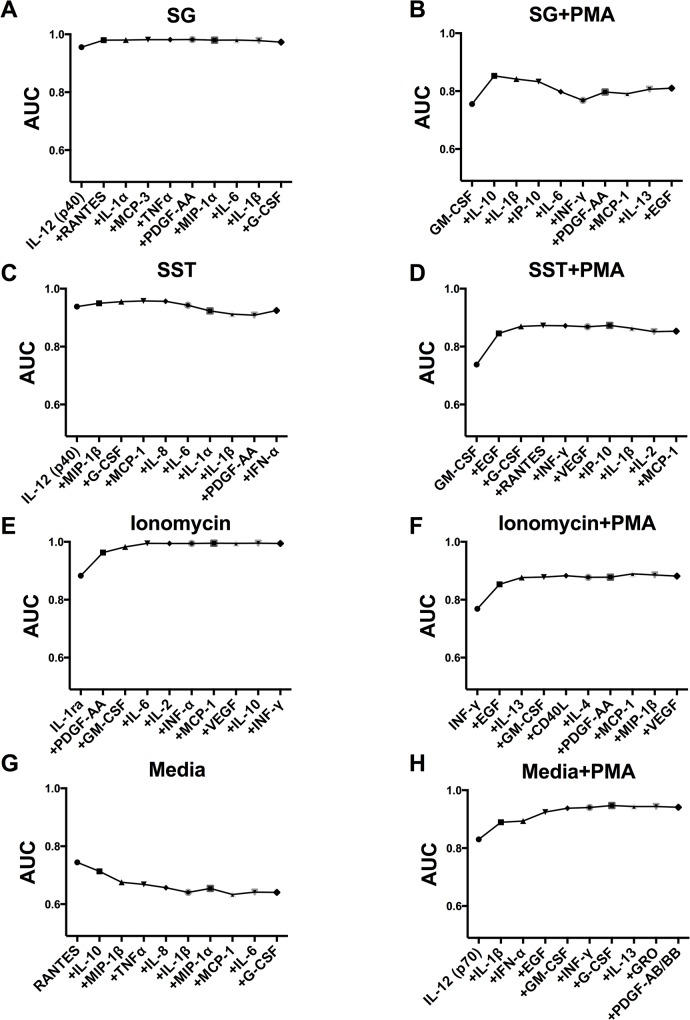
Fig 1. Cytokine and chemokine response signatures and cumulative AUCs from multiple-marker analysis.
The estimated cumulative AUCs from SVM analysis are shown to demonstrate the prediction probability of separating mold-exposed patients from controls for combinations of cytokine and chemokine measurements after challenges. The first cytokine or chemokine shown in each graph is the best cytokine or chemokine (among the tested cytokines and chemokines) to differentiate mold-exposed patients from controls after challenge with the listed cellular exposure. Each subsequent cytokine or chemokine adds additional separation (AUC), as depicted on the graph. Each graph shows the top 10 cytokines and chemokines and the resulting AUC when each additional cytokine or chemokine is added to the model. Note that specific cytokines and chemokines on the x-axis generate a toxin-specific signature. A. Satratoxin G (SG), B. SG + phorbol 12-myristate 13-acetate (PMA), C. S. chartarum spore [mixed] toxins (SST), D. SST + PMA, E. Ionomycin, F. Ionomycin + PMA, G. media (negative control), H. media + PMA.

