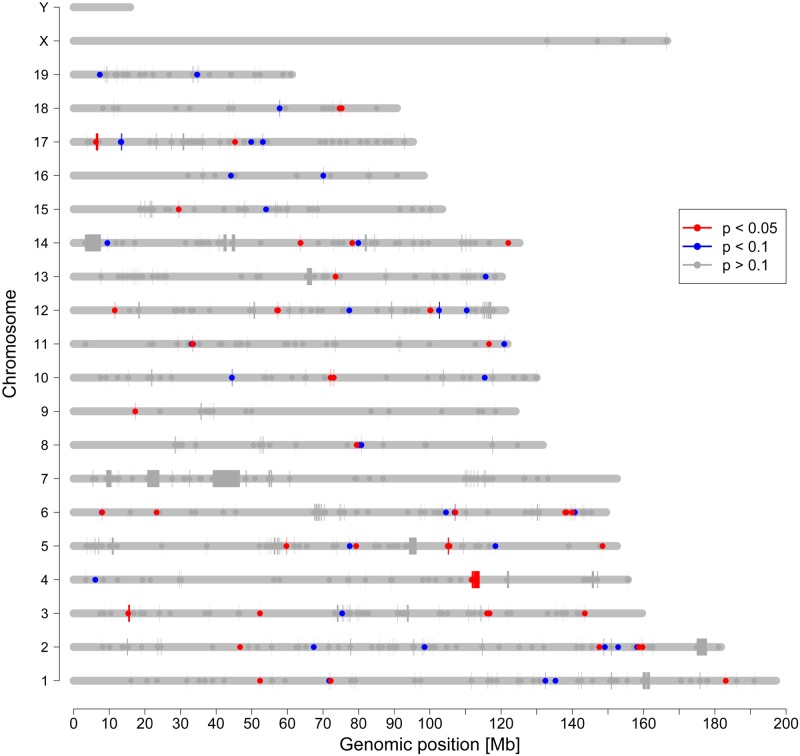
Fig 3. Distribution of CNVs in CD-1 mice.
Chromosomes are indicated by grey horizontal lines. Start points of CNVs are marked by dots and lines are drawn to the end points. Due to limitations in resolution, a small CNV might appear as dot only. CNVs highlighted in blue or red were associated with anxiety-related behavior (time on the open arm of the EPM) with a nominal p-value less than 0.1 or 0.05, respectively.

