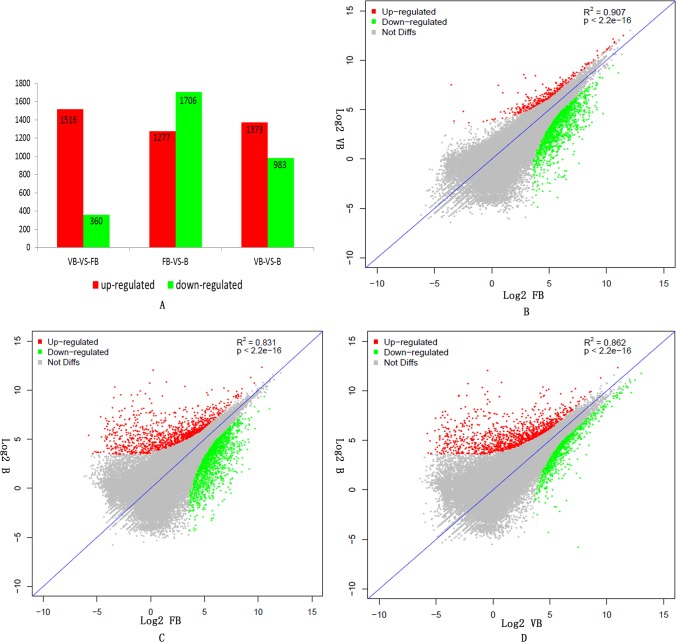
Fig 4. Gene expression differences among the different samples.
A. The numbers of up- and down-regulated genes between vegetative buds (VB), floral buds (FB) and buds (B). B. The correlation scatter plot of gene expression differences between vegetative buds (VB) and floral buds (FB). C. The correlation scatter plot of gene expression differences between floral buds (FB) and buds (B). D. The correlation scatter plot of gene expression differences between buds (B) and vegetative buds (VB).

