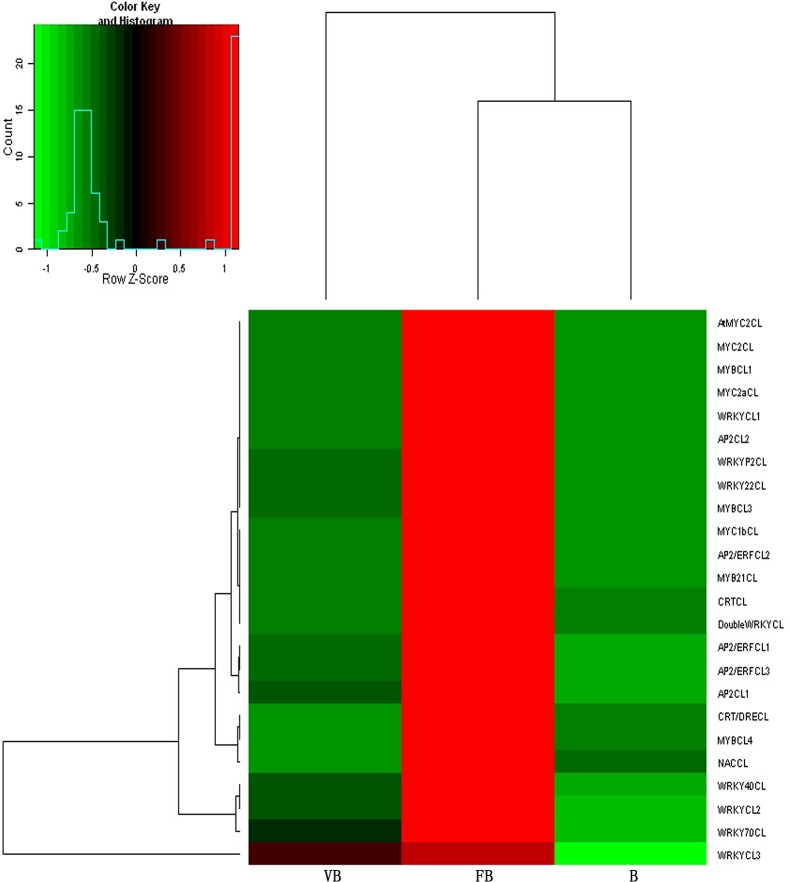
Fig 6. A heat-map showing transcription factor family genes that were differentially expressed between vegetative buds (VB), floral buds (FB) and buds (B) in chrysanthemum.
Columns and rows in the heat maps represent samples and genes, respectively. Sample names are displayed below the heat maps. The color scale indicates fold-change in gene expression. Red indicates high expression and green indicates low expression.

