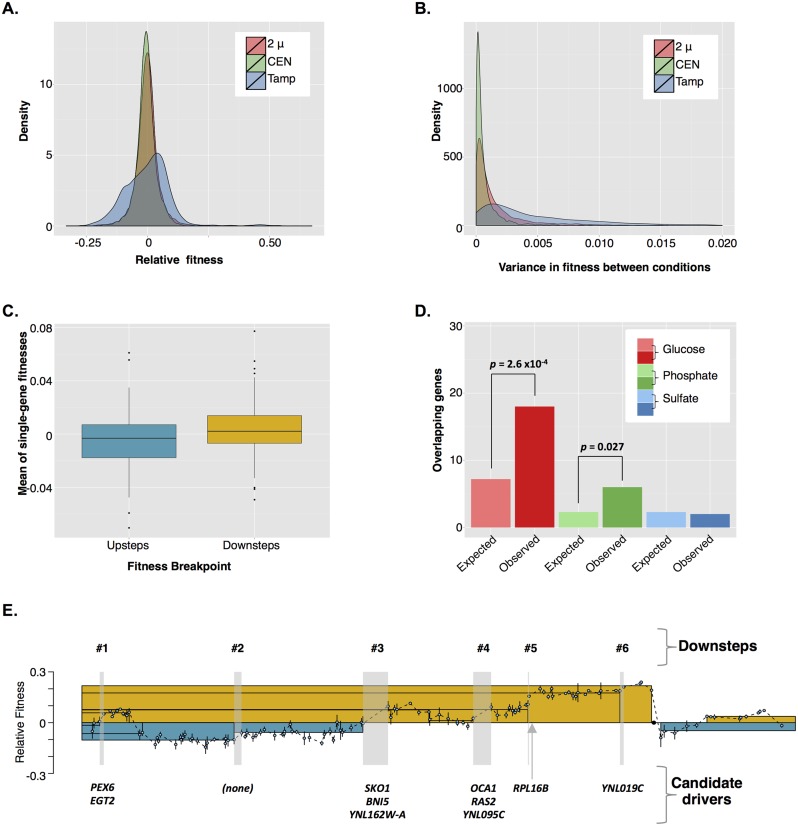
Fig 7. The genetic basis for aneuploidy’s effect on cellular fitness.
A) The fitness landscape explored by Tamps is much broader than that explored by single-gene amplification. CEN = fitness density distribution of a genome-wide collection of yeast strains with each gene cloned into a low-copy-number CEN plasmid (raw data from [34], S2 Table), 2 μ = fitness density distribution of a genome-wide of yeast strains with each gene cloned into a high-copy-number 2 μ plasmid (raw data from [34], S2 Table), Tamp = fitness density distribution of Tamp as determined by the Tamp screen described in this study (raw data from this study S6 Table). B) Tamps are more pleiotropic than single-gene amplifications. Pleiotropy is defined here as the between-condition variance in fitness [See S1 Text]. CEN = density distribution of variance in fitness of a genome-wide collection of yeast strains with each gene cloned into a low-copy-number CEN plasmid (raw data from [34], S2 Table), 2 μ = density distribution of variance in fitness of a genome-wide collection of yeast strains with each gene cloned into a high-copy-number 2 μ plasmid (raw data from [34], S2 Table), Tamp = density distribution of variance in fitness of Tamps as determined by the Tamp screen described in this study (raw data from this study S6 Table). C) The average fitness effects of all single-gene amplifications overlapping a fitness breakpoint is greater for Downsteps than for Upsteps (unpaired, two-tailed t test, p = 0.008). Raw data for individual single-gene amplifications is from [34], S2 Table. Raw data can be found in S17 Table. D) Upsteps in glucose- and phosphate-limiting conditions are enriched for genes mutated in glucose- and phosphate-limited evolution experiments. Raw data can be found in [34], S4 Table; from this study, Upstep and Downstep genes can be found in S17 Table. E) Our Tamp screen predicted amplification of the left arm of chromosome XIV to increase fitness under glucose-limiting conditions. Our Tamp screen identified six Downsteps along this region, all but one of which have a candidate driver gene associated with them. The yellow and blue boxes represent the average relative fitness, positive or negative, respectively, due to amplification of the region enclosed. Raw data can be found in S6 Table, S9 Table, and S11 Table.

