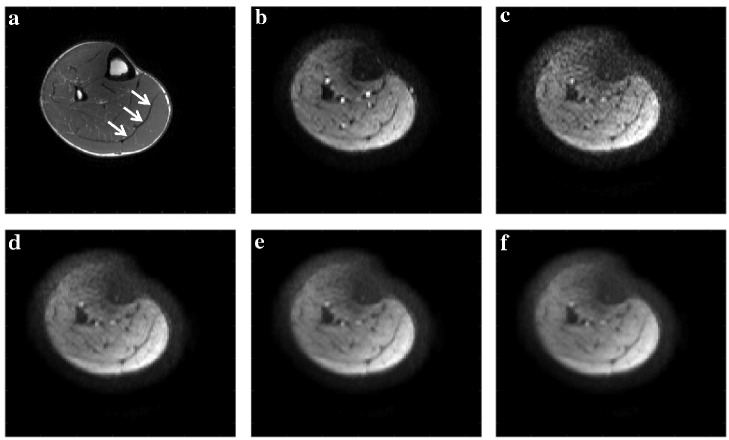
Fig 1. Effect of anisotropic smoothing on diffusion weighted data.
Representative imaging data demonstrate (a) an anatomical image, where the white arrows indicate the location of the medial gastrocnemius aponeurosis; (b) the non-diffusion weighted image (b = 0 image); (c) the acquired diffusion weighted image encoded for the foot-head direction of diffusion. The effects of anisotropic smoothing on the foot-head encoded diffusion image is shown for (d) 5% smoothing; (e) 10% smoothing; and (f) 15% smoothing. Note that the signal loss in the anterior compartment results from the focused shimming of the posterior compartment.

