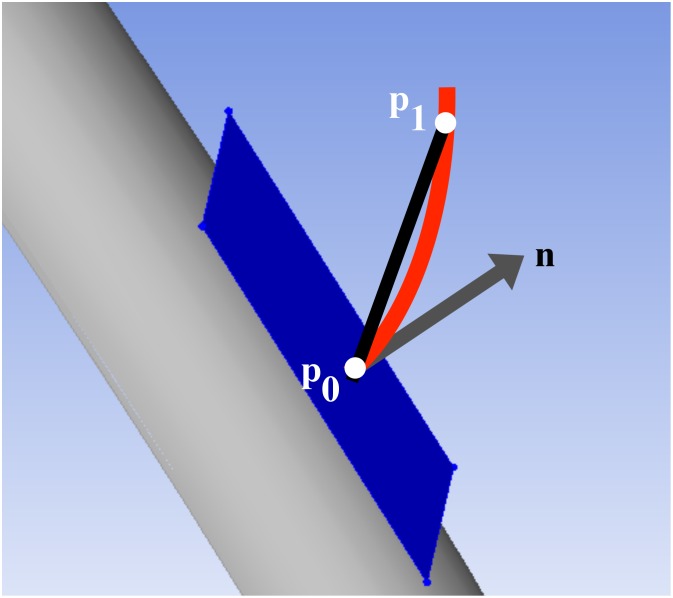
Fig 2. Illustration of pennation angle.
The aponeurosis is represented by the grey manifold, and its tangent plane at point p 0 is shown in blue, with its normal represented by the grey vector, n. For a fiber (red curve) initiated at p 0 and tracked through point p 1, the pennation angle is defined as the angle between the line segment defined by points p 0 and p 1 and the tangent plane.

