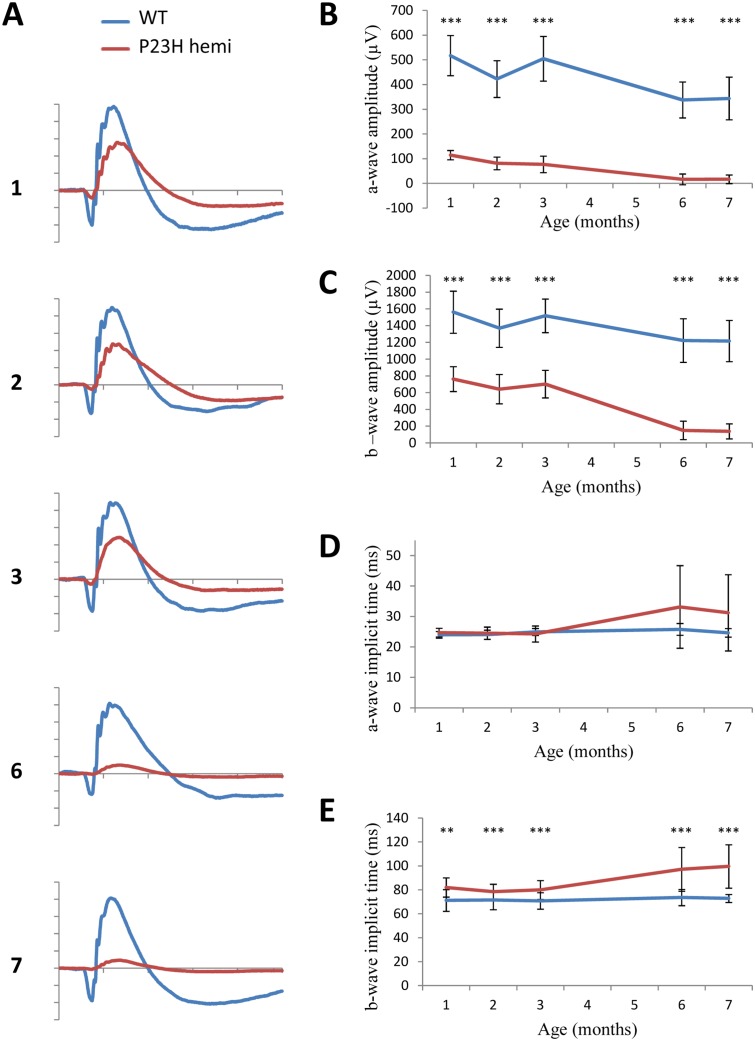
Fig 4. Scotopic ERG phenotype.
Dark-adapted ERG series were obtained from representative WT (n = 12, blue line) and hemizygous P23H-1 (n = 14, red line) rats at 1,2,3,6 and 7 months of age and a 12 cd.s.m-² stimulus intensity. (A) Representative waveforms, as a function of age. The scale marks indicate 50ms (time in abscissa) and 300μV (amplitude in ordinate) (B-C) Mean maximum amplitudes of a-wave (B) and b-wave (C) with increasing age. (D-E) Mean implicit times of a-wave (D) and b-wave (E) with increasing ages of rats. Asteriks indicate a significant test (** for p<0.005 and *** for p<0.001) between WT and hemizygous P23H-1 responses, error bars represent standard errors.

