
Fig 5. Assessments of the mean relative changes in the FIQ, SCL-90 and the SF-36 scores.
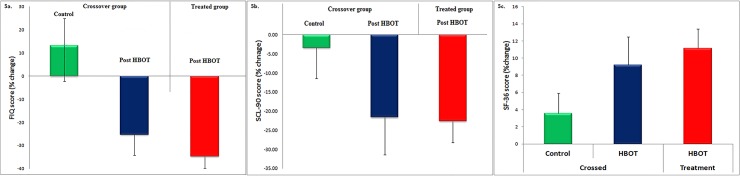
The figures show the mean relative changes and standard errors in the three measures for the crossover group following the control period (green) and following HBOT (blue), and for the treated group following HBOT (red). A) Mean relative changes and standard errors in physical function assessed by the FIQ score. B) Mean relative changes in and standard errors in the psychological distress assessed by the SCL-90 score. c) Mean relative changes and standard errors in the quality of life assessed by the SF-36 score.