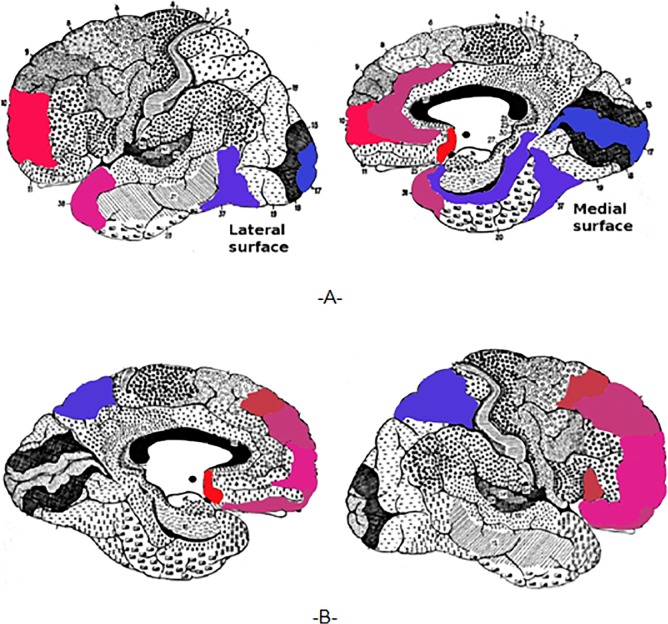
Fig 8. Projection of the significant changes on the brain maps.
The figure shows the results of the normalized mean changes as projected on the brain maps, left BAs (A) and right BAs (B). We colored the BAs that show significant changes in activity using the same color code as in Figs 6 and 7 - from light blue (BA with the strongest activity reduction) to light red (BA with the highest activity elevation).

