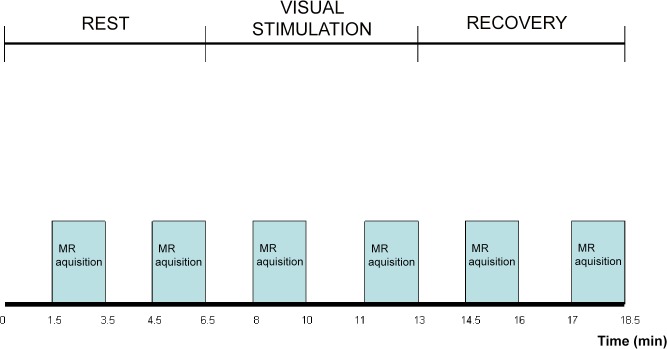
Fig 1. MR brain spectra acquisition for temperature measurement.
On the x axis time is represented (minutes). The bars show the time during which each spectrum is acquired, at rest, during visual stimulation and recovery. Each bar corresponds to one spectrum and to one temperature measurement. The entire study takes 18.5 minutes for each subject.

