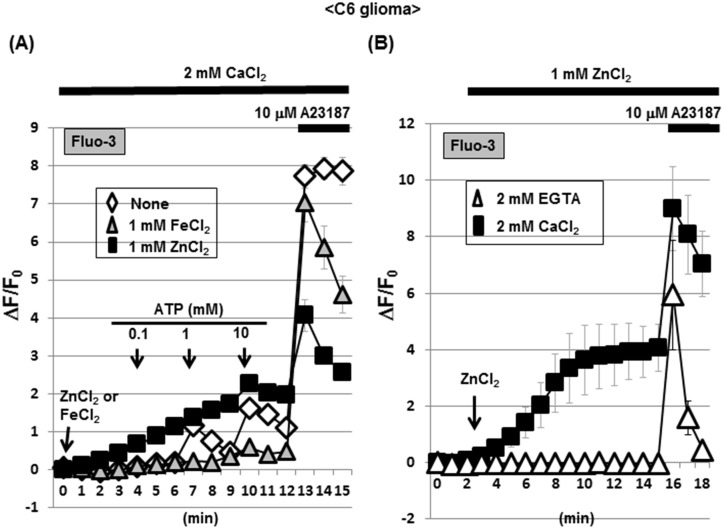
Fig 3. A selective increase by ZnCl2 in Fluo-3 fluorescence in C6 glioma cells.
(A) Cells were loaded with Fluo-3 in the presence of CaCl2, followed by determination of the fluorescence intensity in either the presence or absence of ZnCl2 and FeCl2 every 1 min. Cells were exposed to ATP at different concentrations during the determination of fluorescence. (B) Cells were loaded with Fluo-3 in the presence of either EGTA or CaCl2, followed by determination of the fluorescence intensity in the presence of ZnCl2 every 1 min. Values are the mean±S.E. of the rate of fluorescence change in 3 different experiments.

