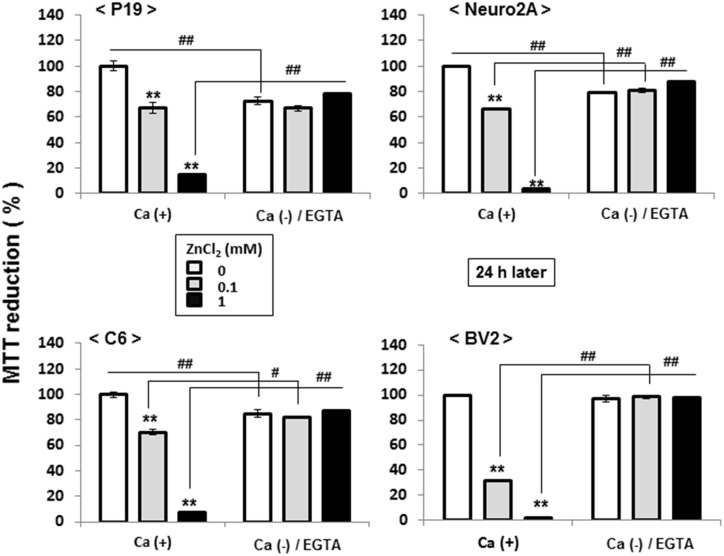
Fig 16. Effects of ZnCl2 on MTT reducing activity in different cell lines.
Cells were exposed to ZnCl2 at 0.1 or 1 mM in either the presence or absence of CaCl2 and EGTA for 1 h, followed by culture for an additional 24 h and subsequent determination of MTT reducing activity. Values are the mean±S.E. of percentages over the maximal activity detected in cells not exposed to any test chemicals in 3 different experiments. *P<0.05, **P<0.01, significantly different from the control value in cells not exposed to ZnCl2. #P<0.05, #P<0.01, significantly different from the value in cells exposed to ZnCL2 at each concentration.

