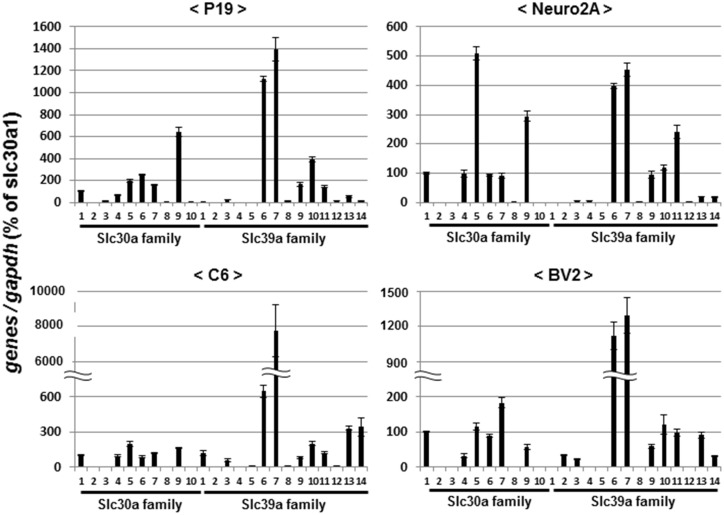
Fig 17. Expression profiles of Zn2+ transporters in different cell lines.
Cells were cultured under respective appropriate conditions, followed by extraction of total RNA and subsequent determination of mRNA expression on qPCR. Values are the mean±S.E. of percentages over the expression of Slc30a1 in 3 different experiments.

