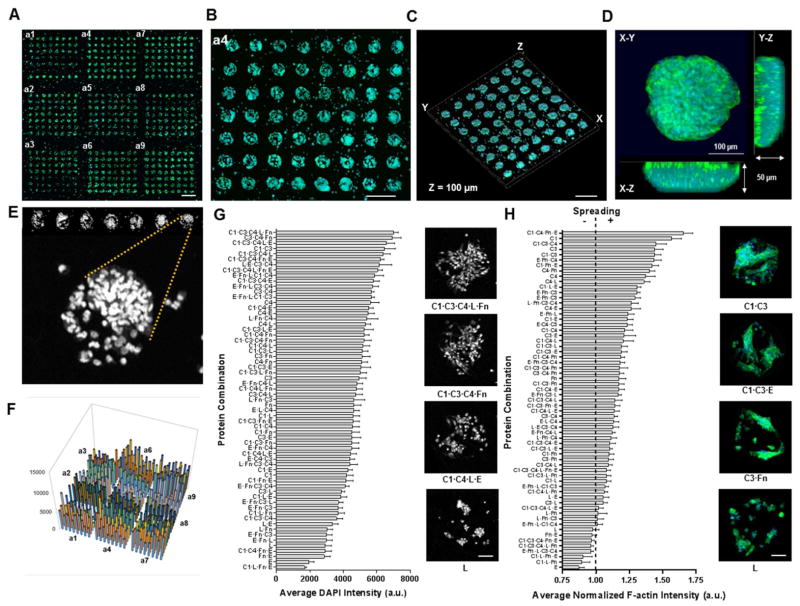
Figure 5.
Rat mesenchymal stem cells (MSCs) adhered on neotissue slides (E = 4.6 kPa substrate). (A) Confocal montage image of neotissue array after 24 h cell culture with distinct cellular islands visible for all protein spotting conditions (scale bar 1 mm)(green, f-actin; blue, DAPI). (B) Magnification of a4 subarray depicting cellular dot circular geometry and periodicity (scale bar 500 μm). (C, D) Confocal 3-dimensional rendering of cell loaded subarray (C)(scale bar 250 μm) and of a single cellular dot (D). (E) Nuclear staining of MSCs seeded on the neotissue arrays for image analysis and quantification. (F) 3-dimensional bar graph representing the average nuclear pixel intensities for all protein combinations for image (A). (G, H) Sorted average pixel intensities for adhesion (G) and spreading (H) for all protein combinations after 24 h cell culture (n = 3 neotissue arrays); Insets depict cellular dot images for adhesion and spreading of representative protein conditions (scale bars 100 μm).

