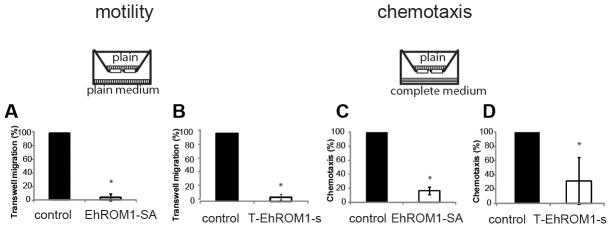
Figure 3. Overexpression of EhROM1-SA and downregulation of EhROM1 in E. histolytica trophozoites result in dramatically decreased motility and chemotaxis.

Motility and chemotaxis were measured by assessing the number of parasites that migrated through the transwell chamber. A total of 1.5×10⁵ parasites were added to the upper chamber of a transwell system and allowed to migrate into the lower chamber for 3 h at 37°C. Overexpression of EhROM1-SA and downregulation of EhROM1 resulted in parasites with strongly diminished migration properties (A and B) and chemotaxis (C and D) though the transwell compared to the control. The average of three independent experiments is shown with standard deviation. Data are shown as a percentage of control strain motility or chemotaxis. The control cell line is overexpressing (A and C) or silencing (B and D) the luciferase gene. The G418 drug concentration in (A and C) is at 12 μg/ml and in (B and D) at 6 μg/ml. Motility: *p-value <5×10⁻⁶ control versus EhROM1-SA; *p-value <2×10⁻⁶ control versus T-EhROM1-s; Chemotaxis: *p-value <1.2 ×10⁻⁵ control versus EhROM1-SA; *p-value <0.02 control versus T-EhROM1-s. Cartoon represents transwell migration chamber with vertical bars representing plain TYI-S-33 media; horizontal bars represent TYI-S-33 media completed with serum and vitamins.
