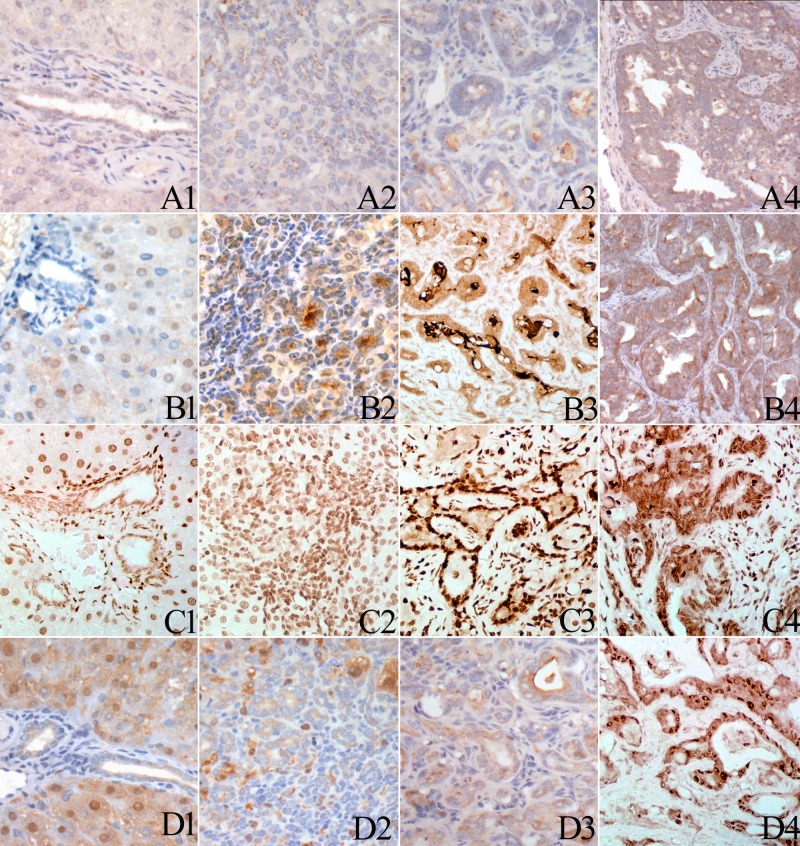
Fig. 3.
Immunohistochemical staining of EGFR, TGFα, STAT3 and p-STAT3 in normal bile ducts, oval cells, CF and ICC. Normal bile ducts showed weak membrane or cytoplasmic staining of EGFR (A1). Oval cells (A2) and bile ducts (A3) in CF show membrane aggregation of EGFR expression. Malignant glands in the ICC exhibited strong membrane staining of EGFR (A4). Normal bile ducts showed weak cytoplasmic staining of TGFα (B1). Elevated TGFα expression was detected in oval cells (B2). Strong cytoplastic staining of TGFα was detected in the bile ducts in CF (B3) as well as in the malignant glands in the ICC (B4). Normal bile ducts showed weak nuclear p-STAT3 expression (C1). Elevated p-STAT3 expression was detected in oval cell (C2). Strong nuclear staining of p-STAT3 was detected in the bile ducts in CF (C3) as well as in the malignant glands in the ICC (C4). Normal bile ducts (D1), oval cells (D2) and bile ducts in CF (D3) showed weak cytoplastic staining of STAT3. some hepatocellular nuclei seem positive for STAT3. Some cases of ICC showed strong cytoplastic and nuclear staining of STAT3 (D4).

