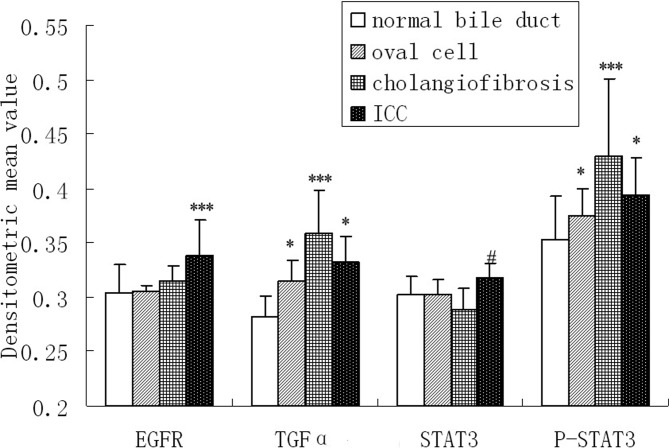
Fig. 4.
IHC results of EGFR, TGFα, STAT3 and p-STAT3 expression in multistage of cholangiocarcinogenesis were semiquantified with an Image-Pro Plus image analysis system. Six different 200× views in each of the 19 cases of ICC, oval cells proliferation area in the livers of rats sacrificed in weeks 5 to 9 after administration of 3’Me-DAB, CF in the livers of rats sacrificed in weeks 12 and 15 after administration of 3’Me-DAB and bile ducts in 10 normal liver tissue specimens of the control group were included in the image analysis. The mean densitometric value was used to represent the staining intensity. Data are expressed as the mean ± standard error (SE). Differences were analyzed using analysis of variance or an independent sample t-test.*** The expression is significantly higher than in other three groups. * The expression in the ICC or oval cell is significantly higher than in normal bile ducts. # The expression of STAT3 in ICC is significantly higher than in CF.

