
Fig. 5.
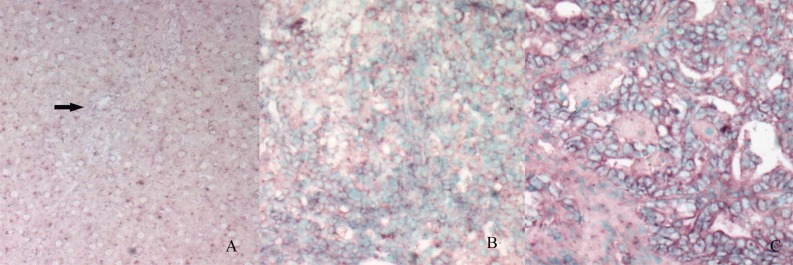
In situ hybridization analysis of STAT3 mRNA expression in the normal liver and bile duct (A, arrow), oval cells (B) and ICC (C).The purple signals are confined to the cytoplasm. Intense signals are seen in the oval cells area and ICC. (The control section hybridized with prehybridization solution without a probe shows no staining [result not shown]).