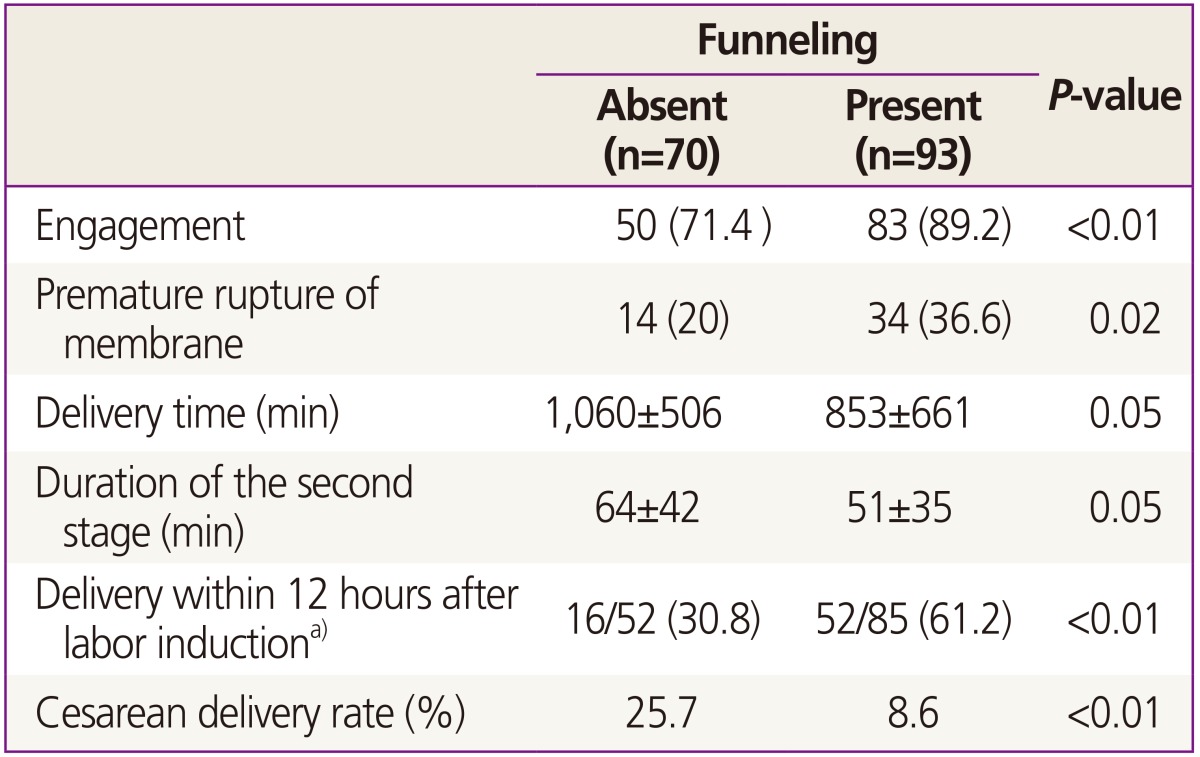
Table 4. Comparison of the delivery outcome.

Values are presented as n (%) or mean±standard deviation unless otherwise indicated.
a)Percentage calculated from number of women with vaginal delivery (n=52 for women without funneling, n=85 for women with funneling).
