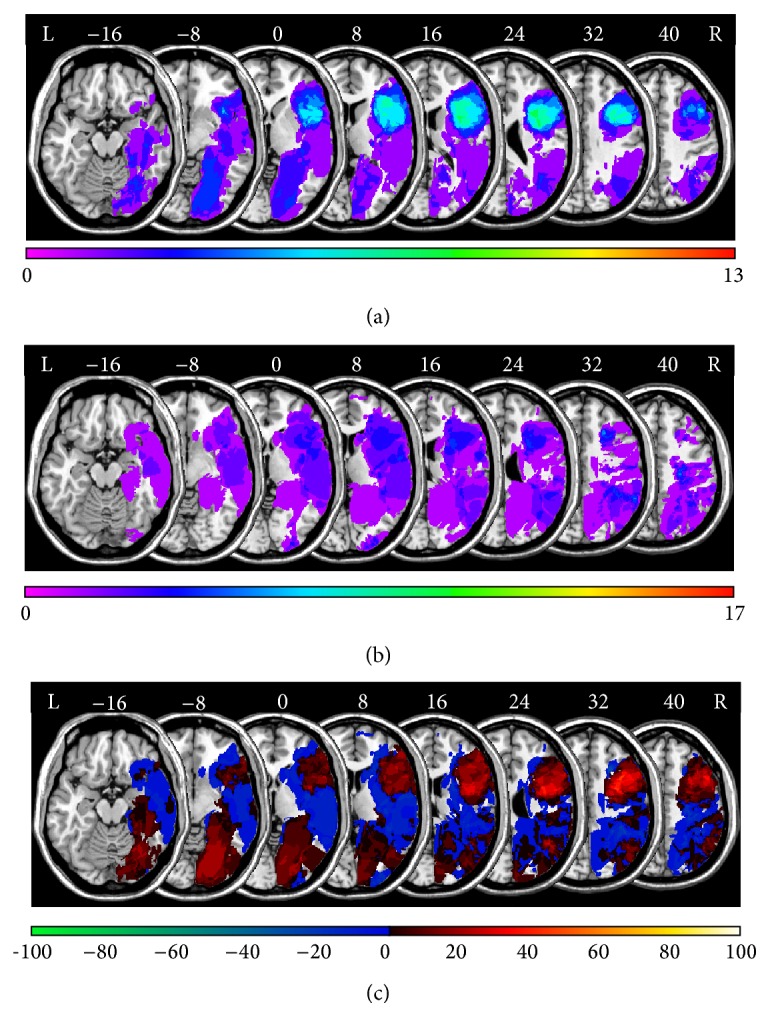
Figure 2.

Anatomical results obtained from the lesion subtraction analysis on the number of TMT-B total errors. (a) Overlay lesion plots for those patients who committed two or more total errors (Mdn = 1) on the TMT-B (N = 13). The number of overlapping lesions is illustrated by color, from violet (N = 1) to red (N = 13). (b) Overlay lesion plots for those patients who committed less than two total errors on the TMT-B (N = 17). The number of overlapping lesions is illustrated by color, from violet (N = 1) to red (N = 17). (c) Overlay plots of the subtracted superimposed lesions of the patients with two or more total errors on the TMT-B minus the patients with less than two total errors on the TMT-B. Colors code increasing frequencies from dark-red (difference from 1% to 20%) to white-yellow (difference from 81% to 100%), indicating regions damaged more frequently in patients who committed relatively many total errors on the TMT-B. The colors from dark-blue (difference from −1 to −20%) to light-green (difference from −81 to −100%) indicate regions damaged more frequently in patients who committed relatively few total errors on the TMT-B.
