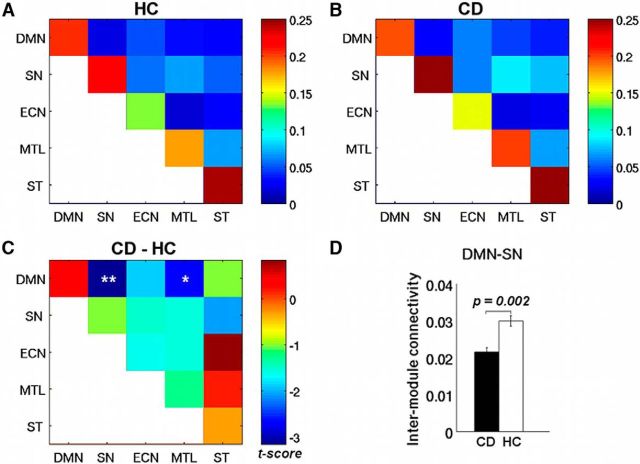
Figure 3.
Intramodule and intermodule connectivity for HC (A) and CD (B) groups. C, Group differences (CD − HC) in intramodule and intermodule connectivity. D, Bar plots for significant differences in intermodule connectivity between DMN and SN, and between DMN and MTL. **pcorrected < 0.05. *puncorreted < 0.05.

