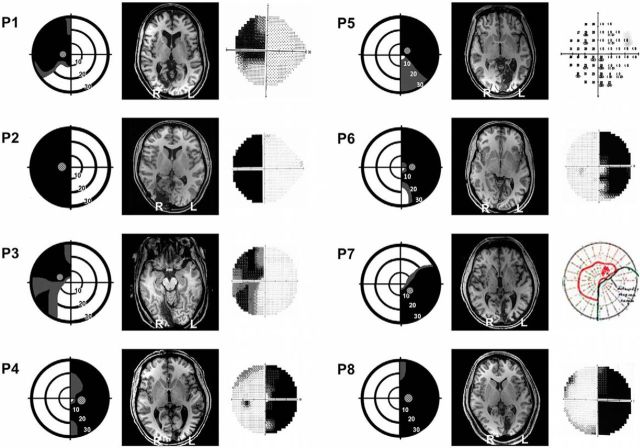
Figure 1.
Visual field deficits and structural MRI scans for all patients. Perimetry reports are depicted schematically for each patient, with the location of the target Gabor stimulus superimposed. Dense visual field loss is shown in black (<0.5%) and partial loss in gray (<2%). Stimuli were always restricted to a region of dense visual field loss, a minimum of 3° from fixation. Concentric rings represent increments in retinal position of 10°, spanning the central 30°. Representative MPRAGE T1 structural axial slices demonstrating lesion location are also provided, with radiological convention. Humphrey perimetry maps (Goldmann for P7) are included on the right side. Note that, on the Goldmann map, the red line represents the area in which the patient could detect stimulus of parameters “i2e,” i.e., size i (0.1°), intensity 2e. For P5, this is a screenshot of the raw Humphrey thresholds at each retinal location.

