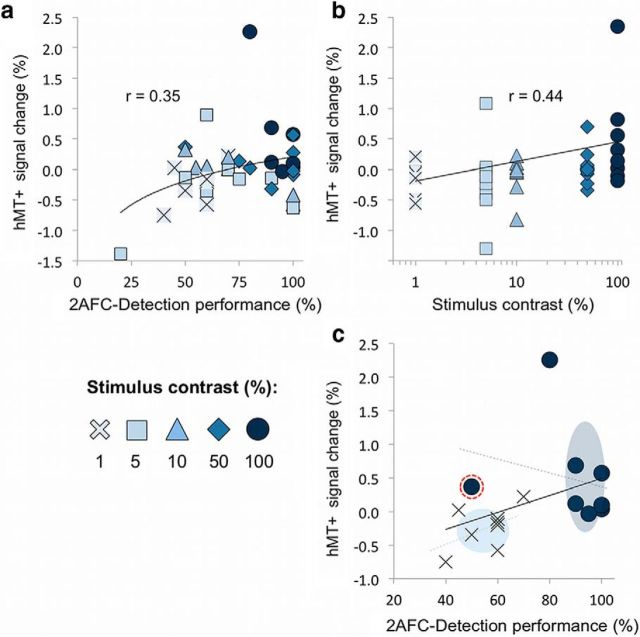
Figure 11.
The relative influence of contrast and detection performance on hMT+ activity in patients. a, hMT+ shows a significant logarithmic relationship with blindsight performance across all patients, with the contribution of stimulus contrast appreciated using a color scale and distinct symbols. b, As shown previously, hMT+ shows a linear relationship with stimulus contrast. c, Results for only 1 and 100% contrast from a are replotted here. The overall trend line is shown (black line, r = 0.4), as well as individual trend lines for both contrast levels (dotted colored lines). Similar analyses were also performed for 5, 10, and 50% contrast (data not shown). There is clear clustering according to contrast in both the x (performance) and y (signal change) planes, illustrated by colored ellipses representing the mean and SD at each contrast level. The data point highlighted inside the dotted red circle indicates a different contrast–fMRI–performance relationship, which corresponds to results for the blindsight-negative patient (P3).

