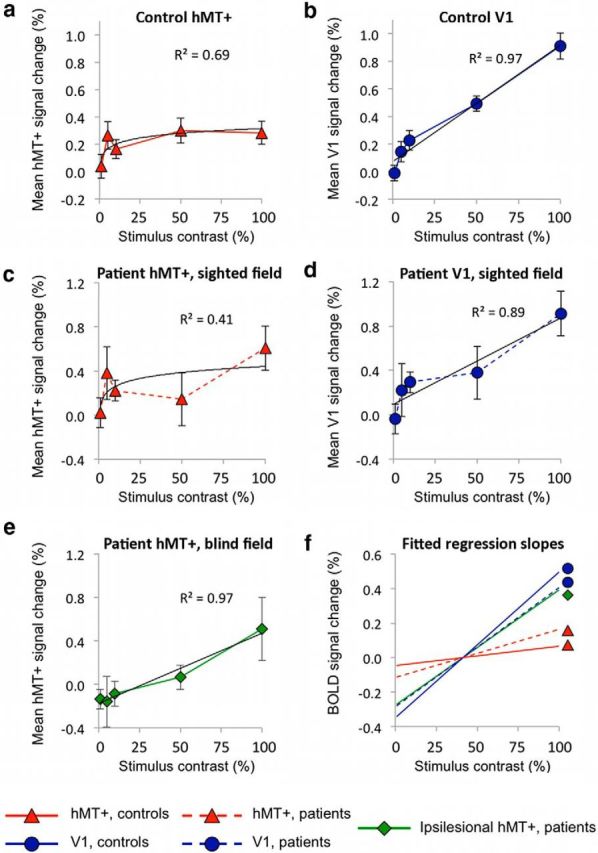
Figure 4.

Group plots of signal change versus stimulus contrast within V1 or hMT+ ROIs. a, Control group hMT+ shows an early saturation at low levels of contrast, described by a logarithmic response. b, Control V1 shows a much stronger linear component, with signal change continuing to increase with each rise in stimulus contrast. c, Sighted hMT+ response in patients shows high signal change at 5 and 100% contrast. d, Sighted V1 in the undamaged hemisphere of patients, similar to controls, shows a predominantly linear relationship with increasing contrast. e, Ipsilesional hMT+ in patients is best described by a linear relationship with contrast (MSE, 0.002). f, Normalized linear regression lines between 5 and 100% contrast capture the early plateau of activity in normal hMT+ responses. hMT+ in controls (red triangle) and the sighted hemifield of patients (dotted red, triangle) both show shallow increases in signal change representative of this early saturation in activity. Conversely, V1 of controls (blue circle) and the intact hemisphere of patients (dotted blue, circle) show a comparable, steeper gradient that is notably similar to the regression line for hMT+ during blind field stimulation in patients (green diamond).
