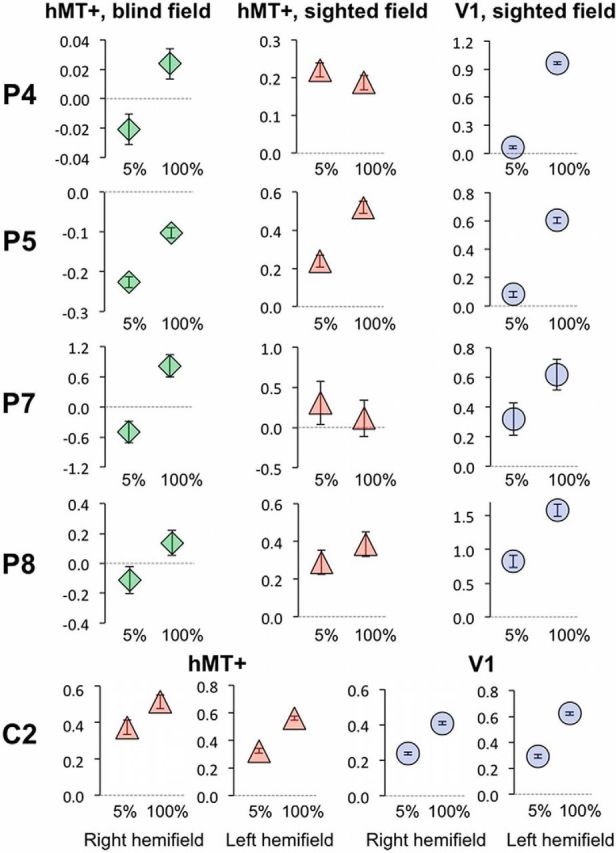
Figure 5.

Individual hMT+ and V1 signal change at 5 and 100% contrast. Representative data are shown here for four patients (P4, P5, P7, and P8) and one control (C2). Mean signal change is shown for hMT+ during blind hemifield (left column, green diamonds) or sighted hemifield (middle column, red triangles) stimulation. The right column (blue circles) depicts signal change in V1 of the intact hemisphere during sighted field stimulation. Error bars represent the voxelwise variance estimate across the ROI. Signal change axes are matched for peak and minimum values and always go through zero (dotted gray line).
