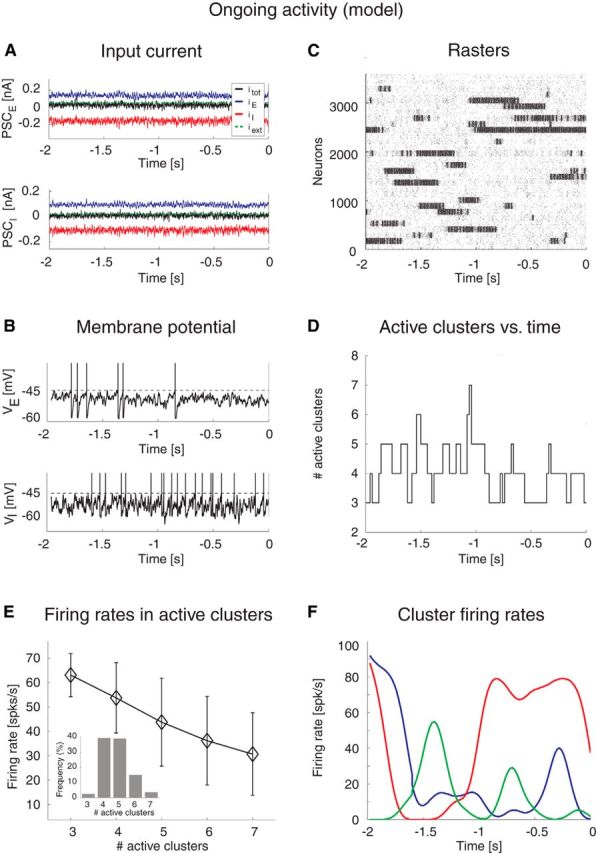
Figure 4.

Dynamics of the spiking network model during ongoing activity. Simulation of the network in Figure 3 with 4000 excitatory and 1000 inhibitory LIF neurons, Q = 30 clusters at intracluster synaptic potentiation J+ = 5.2. A, Incoming PSC to an excitatory (PSCE, top plot) and an inhibitory (PSCI, bottom plot) neuron: EPSC (blue trace), IPSC (red trace), external current (green line), and total current (black trace) are in a balanced regimen. x-axis, time (seconds); y-axis, PSC (nA). B, Membrane potential from representative excitatory (VE, top plot) and inhibitory (VI, bottom plot) neurons. Vertical bars represent spikes. Horizontal dashed lines indicate threshold for spike emission. x-axis, time (seconds); y-axis, membrane potential V (mV). For illustration purposes, V was linearly transformed to obtain the threshold for spike emission at −45 mV and the reset potential after a spike at −60 mV. C, Representative rasterplot from excitatory clustered neurons. Each dot represents a spike (background population not shown). Clusters of neurons that are currently active appear as darker regions of the raster. x-axis, time (seconds); y-axis, neuron index. D, Time course of the number of active clusters from the representative trial in C. x-axis, time (seconds); y-axis, number of active clusters. E, Average firing rates in the active clusters as a function of the number of active clusters across all simulated sessions. Error bars indicate SD. x-axis, number of active clusters; y-axis, average cluster firing rate (spikes/s). Inset, Occurrence of states with different counts of active clusters for 5% stimulus amplitude. x-axis, number of active clusters; y-axis, frequency of occurrence (% of total time). F, Instantaneous cluster firing rate in three representative clusters (red, blue, and green lines) from trial in C. x-axis, time (seconds); y-axis, firing rate (spikes/s).
