Figure 6.
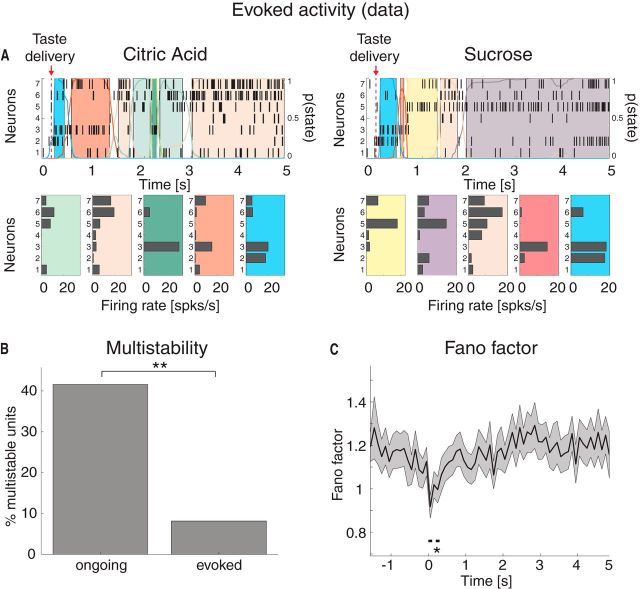
Taste-evoked activity: reduction of multistability and trial-by-trial variability in the experimental data. A, Two representative examples of population rasters together with their segmentation in HMM states during evoked activity in GC, in response to citric acid (left) and sucrose (right) delivery, respectively. Red arrow indicates taste delivery at t = 0. The remaining notations are as in Fig. 1A. Top, x-axis, time relative to taste delivery (0 = stimulus delivery); y-axis, left, ensemble neuron index, right, probability of HMM states. Bottom, x-axis: firing rates (spikes/s); y-axis, ensemble neuron index. B, Fraction of multistable neurons across all states during ongoing (left) and evoked activity (right) in GC. **p < 0.01 (χ2 test). x-axis, ongoing and evoked conditions; y-axis, fraction of multistable neurons (%). C, Time course of the mean-matched FF in a time interval around taste delivery (occurring at time t = 0) across all data. Shaded bounds represent 95% CIs. The thick horizontal black line indicates bins where the evoked FF is significantly different from baseline (*p < 0.05, see Materials and Methods). x-axis, time (seconds); y-axis, FF.

