Figure 8.
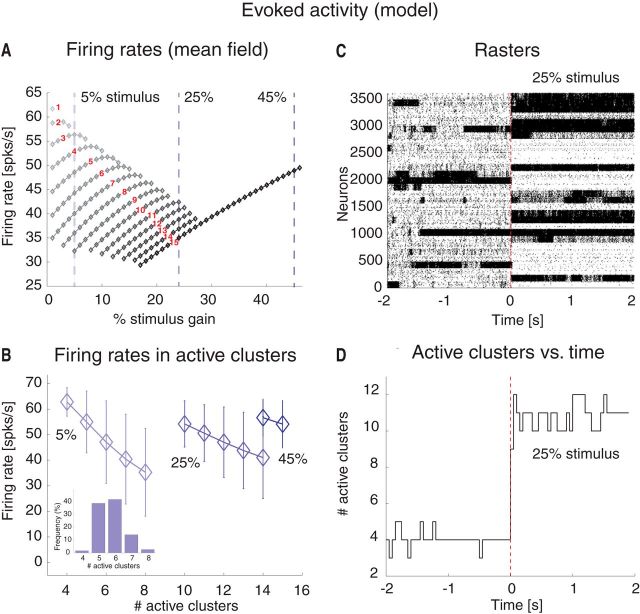
Mean field predictions of evoked activity and comparison with model simulations. A, Attractor states of the model during evoked activity predicted by mean field theory for J+ = 5.2 and as a function of stimulus amplitude. Diamonds represent mean firing rate in active clusters for each attractor state, featuring the number of active clusters indicated by the red numbers (see also Fig. 3B). Stimulus amplitude varied from 1% to 45% of vext. Vertical dashed lines indicate attractor states for stimuli of 5%, 25%, and 45%. The firing rate range decreases as the stimulus amplitude is increased, and it reduces to a single configuration with 15 active clusters for stimuli >30%. x-axis, stimulus increase (%); y-axis, firing rate (spikes/s). B, Mean firing rates in active clusters in simulations of the model for the three stimuli marked by vertical lines in A. Error bars indicate SD. x-axis, number of active clusters; y-axis, average cluster firing rate (spikes/s). Inset, Frequency of configurations with different numbers of active clusters for 5% stimulus. x-axis, active clusters; y-axis, frequency of occurrence (% of total simulation time across all simulations). C, Rasterplot of spike trains from excitatory clustered neurons (background excitatory population not shown) in a representative trial encompassing both periods of ongoing and evoked activity (compare with Fig. 4C), using a “box” stimulus with amplitude at 30% of vext in the [0, 2]s interval (ongoing activity corresponds to the [−2, 0]s interval). Vertical red line indicates stimulus onset. x-axis, time (seconds); y-axis, neuron index. D, Number of active clusters versus time (same representative trial as in C). Notations as in Fig. 4D. x-axis, time (seconds); y-axis, active clusters.

