
Figure 8.
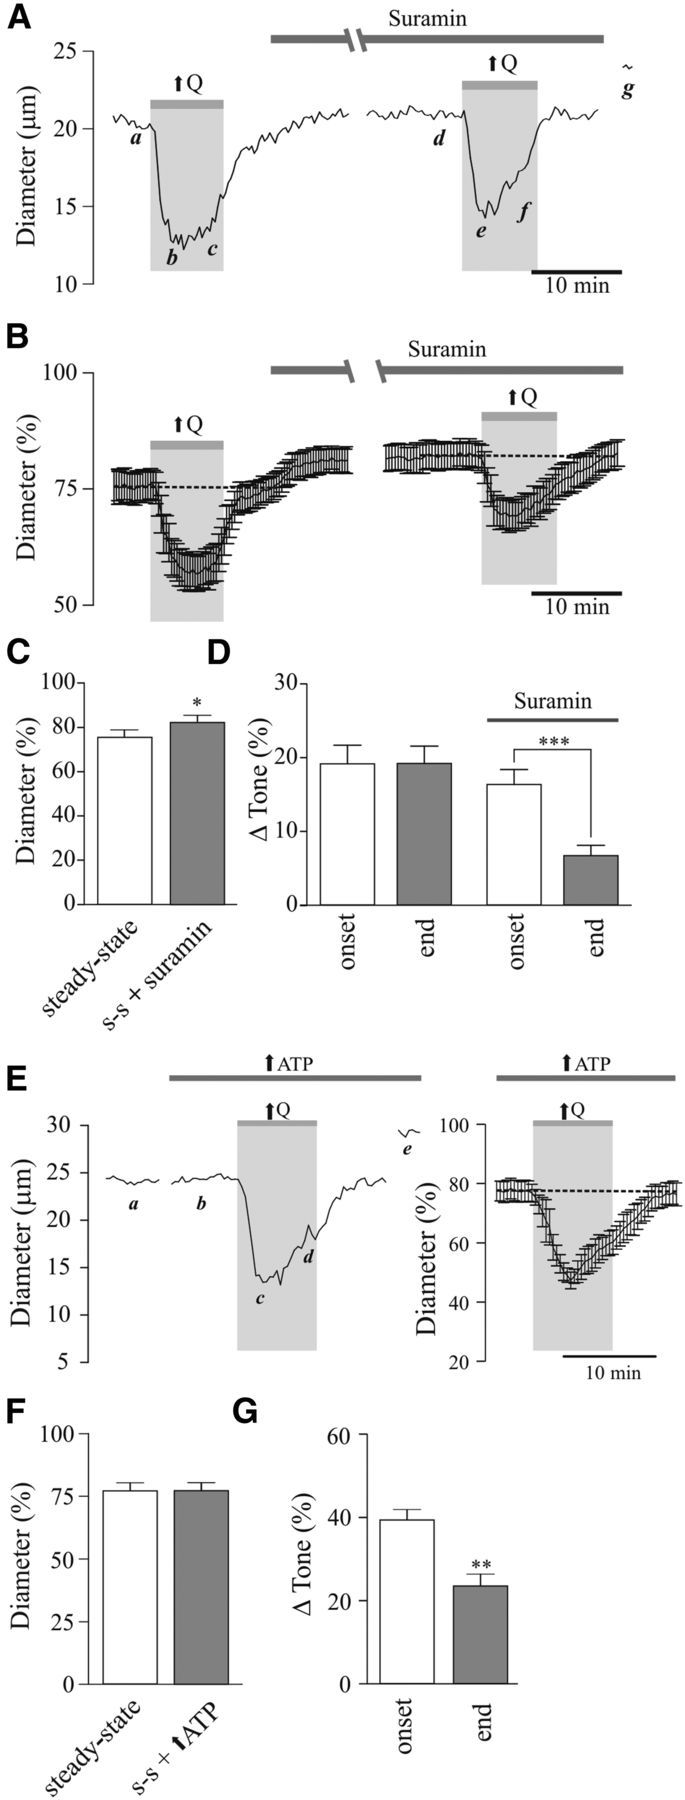
Contribution of purinergic signaling to flow/pressure-evoked increases in PA tone. A, Representative trace showing diameter changes in response to flow increases (↑Q) before and after bath application of suramin [500 μmol/L; a, d: steady-state (s-s) tone; b, e: peak constriction at stimulus (↑Q) onset; c, f: tone at the end of ↑Q stimulus; g: maximum diameter in zero Ca2+ + papaverine]. B, Averaged diameter (percentage from maximum) changes in response to ↑Q before and after suramin perfusion. C, Averaged s-s tone (percentage from maximum) before and after suramin perfusion. D, Averaged Δ tone (percentage) at the onset and end of the ↑Q stimulus. E, Representative trace (left) and average diameter (right) changes in response to ↑Q, before and after high ATP loading into the astrocytic syncytium (a, b: s-s tone; c: peak constriction at stimulus (↑Q) onset; d: tone at the end of ↑Q stimulus; e: maximum diameter in zero Ca2+ + papaverine). F, Averaged s-s tone (percentage from maximum) before and after suramin perfusion. G, Averaged Δ tone (percentage) at the onset and end of the ↑Q stimulus. *p < 0.05, **p < 0.01.