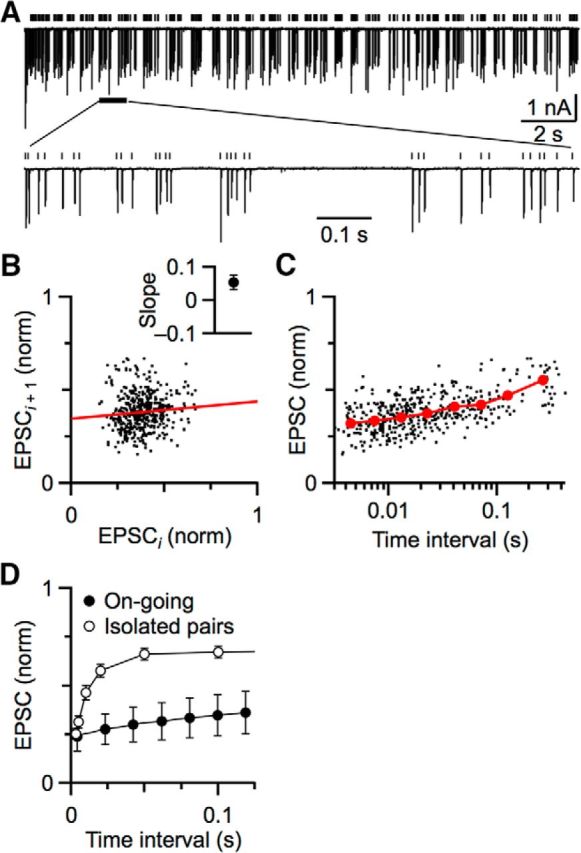
Figure 1.

Simple analyses of EPSC amplitudes at the endbulb synapse fail to reveal short-term plasticity during ongoing activity. A, EPSCs were evoked by stimulating single auditory nerve fibers for 20 s at 25 Hz. Bottom, Portion of the data on an expanded timescale. Vertical lines indicate the timing of stimulations. B, Lack of correlation between adjacent EPSCs. Each EPSC in the train in A is designated as EPSCi, and the subsequent EPSC as EPSCi + 1. The slope of the fit (0.09 ± 0.05) indicates no correlation. Inset, Average slope from 5 cells, which is not significantly different from 0 (p = 0.1). C, Weak effect of previous interval on subsequent EPSC amplitude. Each dot is one EPSC from the train plotted against its previous interval. Red circles represent binned averages of 440 EPSCs. D, Average relationship between EPSC and previous interval during ongoing activity from 5 experiments (closed circles). For comparison, we show the same relationship when synapses were activated in pairs of stimuli of various intervals, with paired stimuli well isolated in time from each other (open circles). Data are from Yang and Xu-Friedman (2009). These “rested” synapses show faster and greater recovery.
