Figure 5.
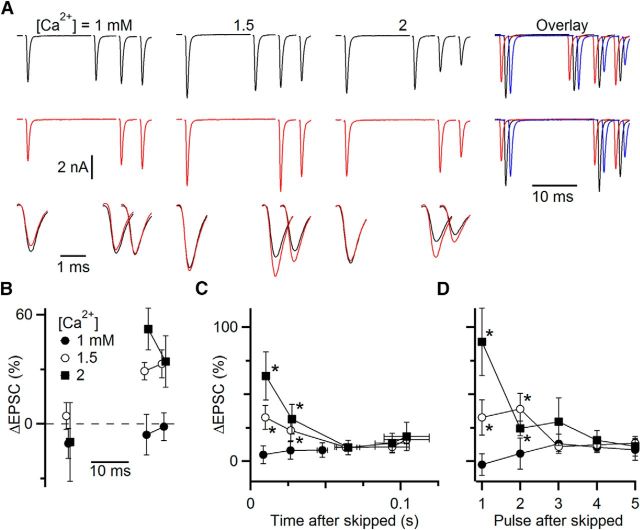
Using skipped stimuli to study the influence of initial probability of release (Pr) on EPSC amplitude during ongoing activity. Pr was manipulated by changing the bath calcium concentration. A, Example experiment testing different calcium concentrations in a single cell. Long trains of EPSCs were applied (top traces, 50 Hz Poisson-distributed), of which only EPSCs 15–18 are shown, with stimulus 16 skipped on alternate trials (middle traces). Bottom traces, overlaid, Average EPSCs from control and skipped trials on an expanded timescale. Right, EPSCs from 1.0 mm (red), 1.5 mm (black), and 2 mm (blue) Ca2+ are overlaid with small offsets for comparison. B, The percentage change in EPSC amplitude between skipped and control trials from A. C, D, Results from 9 similar experiments. Percentage changes after the skipped stimulus are averaged by time (C) or based on the pulse following the skipped stimulus (D). Both show a large initial increase, which then decays back to 0. Increases were significant for 1.5 and 2 mm Ca2+ for the first 40 ms (C) or 2 pulses (D) after the skipped stimulus (*p < 0.05 for both calcium concentrations). Changes were not significant for 1 mm Ca2+. This indicates that the dominant form of plasticity is depression in 1.5 and 2 mm Ca2+.

